Climate and Stratospheric Ozone
Using ideal CESM models to assess the effect of stratospheric ozone on the climate.
For my CLIMATE 473 Climate Physics course, I used an aquaplanet model to simulate how increases and decreases in stratospheric ozone can impact the climate system. This page gives a summary of the key results. For further details, you can find the full project report I made for the assignment at the bottom of the page.
Table of contents
- The Radiative Properties of Ozone
- The Aquaplanet Model
- Atmospheric Circulation
- Energy Balance
- Quasi Biennal Oscillation
- Future Work
- Full Report
The Radiative Properties of Ozone:
Stratospheric ozone, despite it’s relatively small concentration compared to other gases in the atmosphere, has a large influence on the climate on Earth. Ozone in the stratosphere is primarily responsible for the existence of a tropopause, where lapse rate of temperature switches sign and separates the unstably stratified troposphere from the stably stratified stratosphere. Ozone has strong interactions with both shortwave (SW) and longwave (LW) radiation.
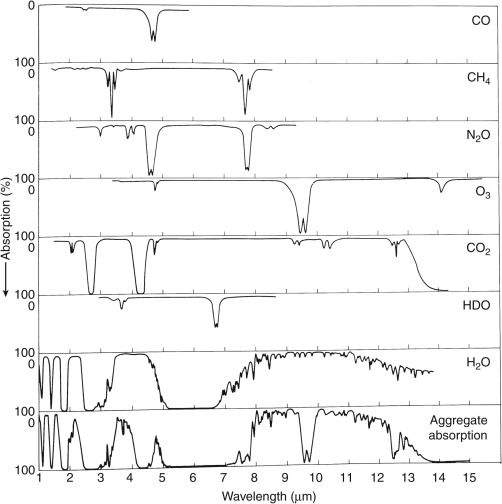
Light at UV wavelengths in the stratosphere are absorbed by molecular oxygen (O2) and by ozone (O3) itself. The absorption by O2 is essential in the creation of ozone while the absorption of O3 is a key destructive process of ozone. In an oxygen rich atmosphere like Earth’s, the concentration of ozone in the stratosphere is largely a balance between these photochemical creation and destruction processes. These reactions create a continuum absorption band of UV radiation between around \(200-300\text{ nm}\).
Additionally, ozone has a strong vibration-rotation absorption band around \(9.6~\mu\text{m}\) which lies in Earth’s atmospheric window shown in Fig. 1. The atmospheric window is a region on the infrared spectrum between 8 to 13 \(\mu\text{m}\) where the atmosphere is relatively transparent due to a lack of molecules with absorption bands here. However, since ozone’s infrared absorption line lies within this window, changes in ozone concentration can strongly influence how transparent the window is and importantly how much radiation at these wavelengths escapes out to space.
The Aquaplanet Model
An aquaplanet simulation is an idealized global atmospheric model that is completely water-covered with no land, topography, or sea ice. Aquaplanets use a data ocean, an ocean model that uses data to force and determine its state. In the Community Earth System Model (CESM), data-oceans come in two forms: a pure data model based an prescribed sea surface temperatures (SSTs) or a slab-ocean model where bottom heat flux and boundary layer depths are supplied to update SSTs based on atmosphere-ocean fluxes. Additionally, while aquaplanets maintain a diurnal cycle, a perpetual equinox with a perfectly circular orbit (eccentricity and obliquity of zero) is enforced, resulting in no seasonal cycle. Aquaplanets provide a bridge in the hierarchy of atmospheric general circulation models between simplified physics component sets like the Held-Suarez configuration and Earth-like simulations used in the Atmospheric Modeling Intercomparison Project (AMIP).
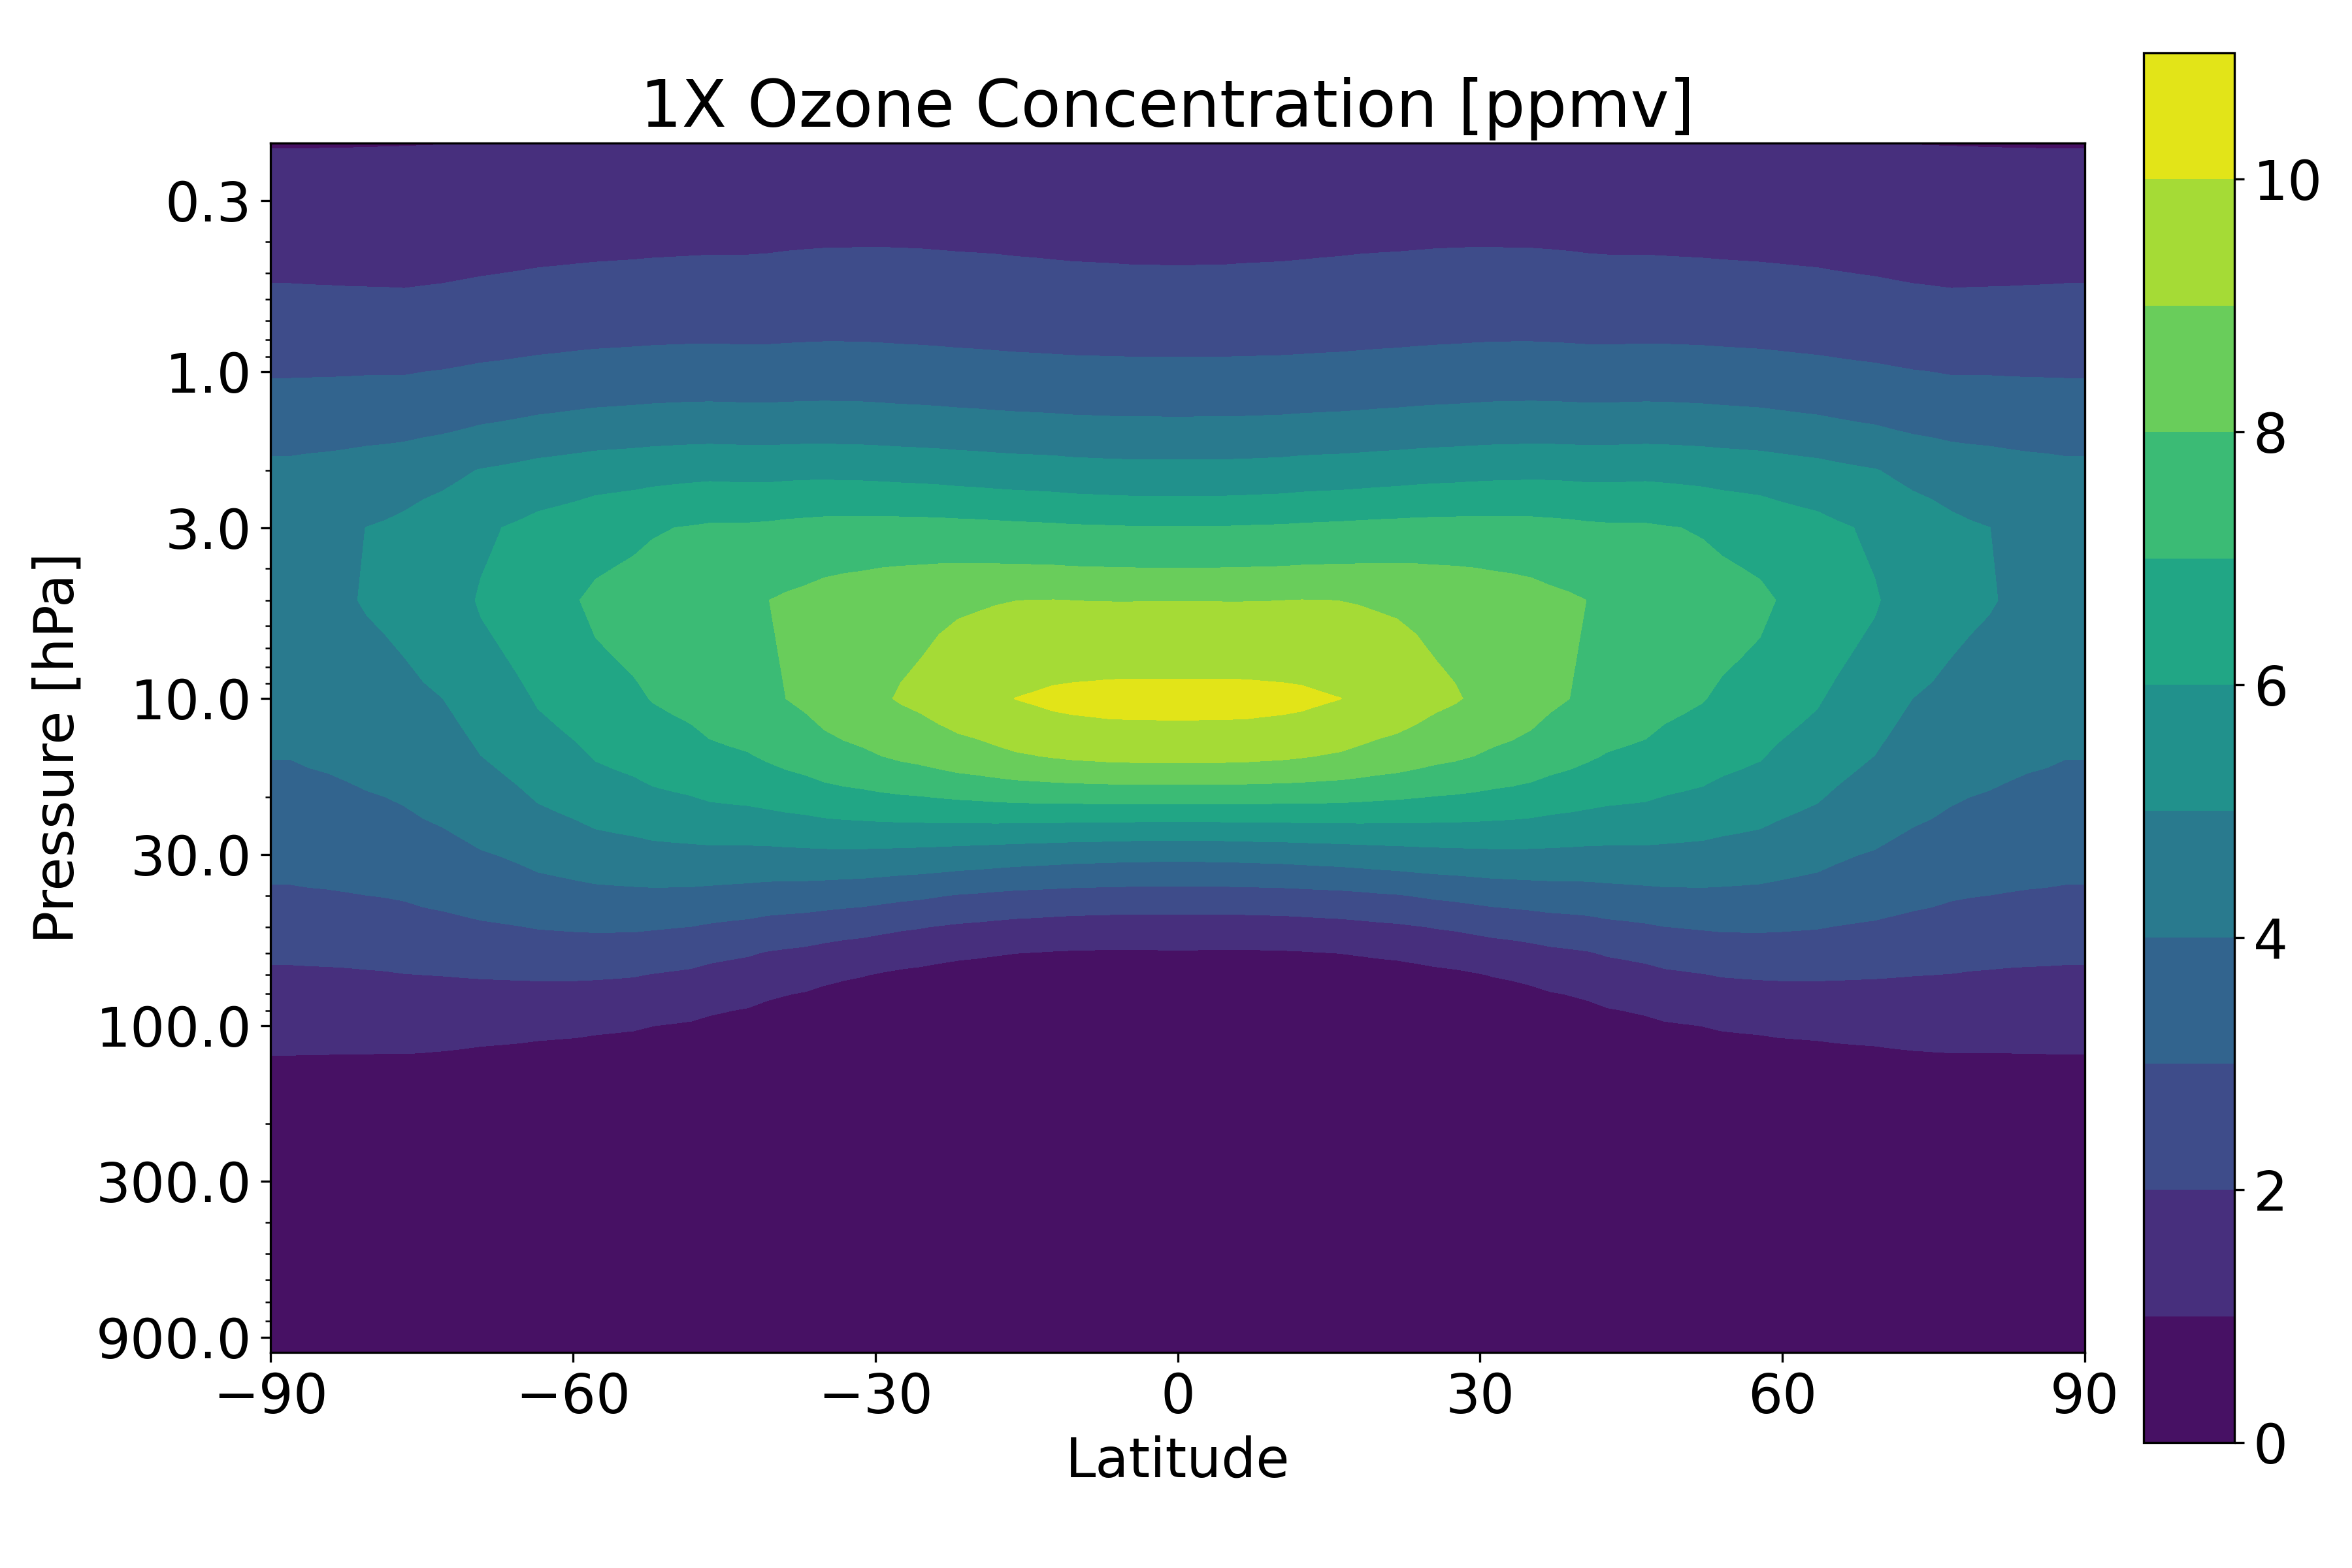
For this project, I ran three 10 year-long, fixed SST aquaplanet simulations with prescribed ozone concentrations. The first is a control ozone simulation \((1\times\text{O3})\), shown in Fig. 2, with a zonally-uniform, time-independent ozone distribution based upon the Aquaplanet Experiment Project standards that is based upon AMIP climatologies. In order to observe how increases and decreases to ozone impact climate, the other two runs apply a \(4\times\) and \(1/4\times\) factor to the \(1\times\text{O3}\) control run respectively. For more details see the dropdowns below:
The Model Details
- NCAR’s Community Earth System Model (CESM)
- Aquaplanet Configuration with Prescribed SSTs (QPC4)
- Community Atmosphere Model (CAM) Version 4 (user guide and a detailed scientific description available here)
- Spectral Element Dynamical Core
- 2-Degree Horizontal Resolution
- 72 Level Vertical Resolution with Model Top at 0.1 hPa (~60 km)
- 10 year simulations with monthly mean output: Only the last 5 years are used in time-averages.
- Analytic moist baroclinic wave initial conditions ( moist_baroclinic_wave_dcmip2016 based on Ullrich et. al 2014)
Atmospheric Circulation
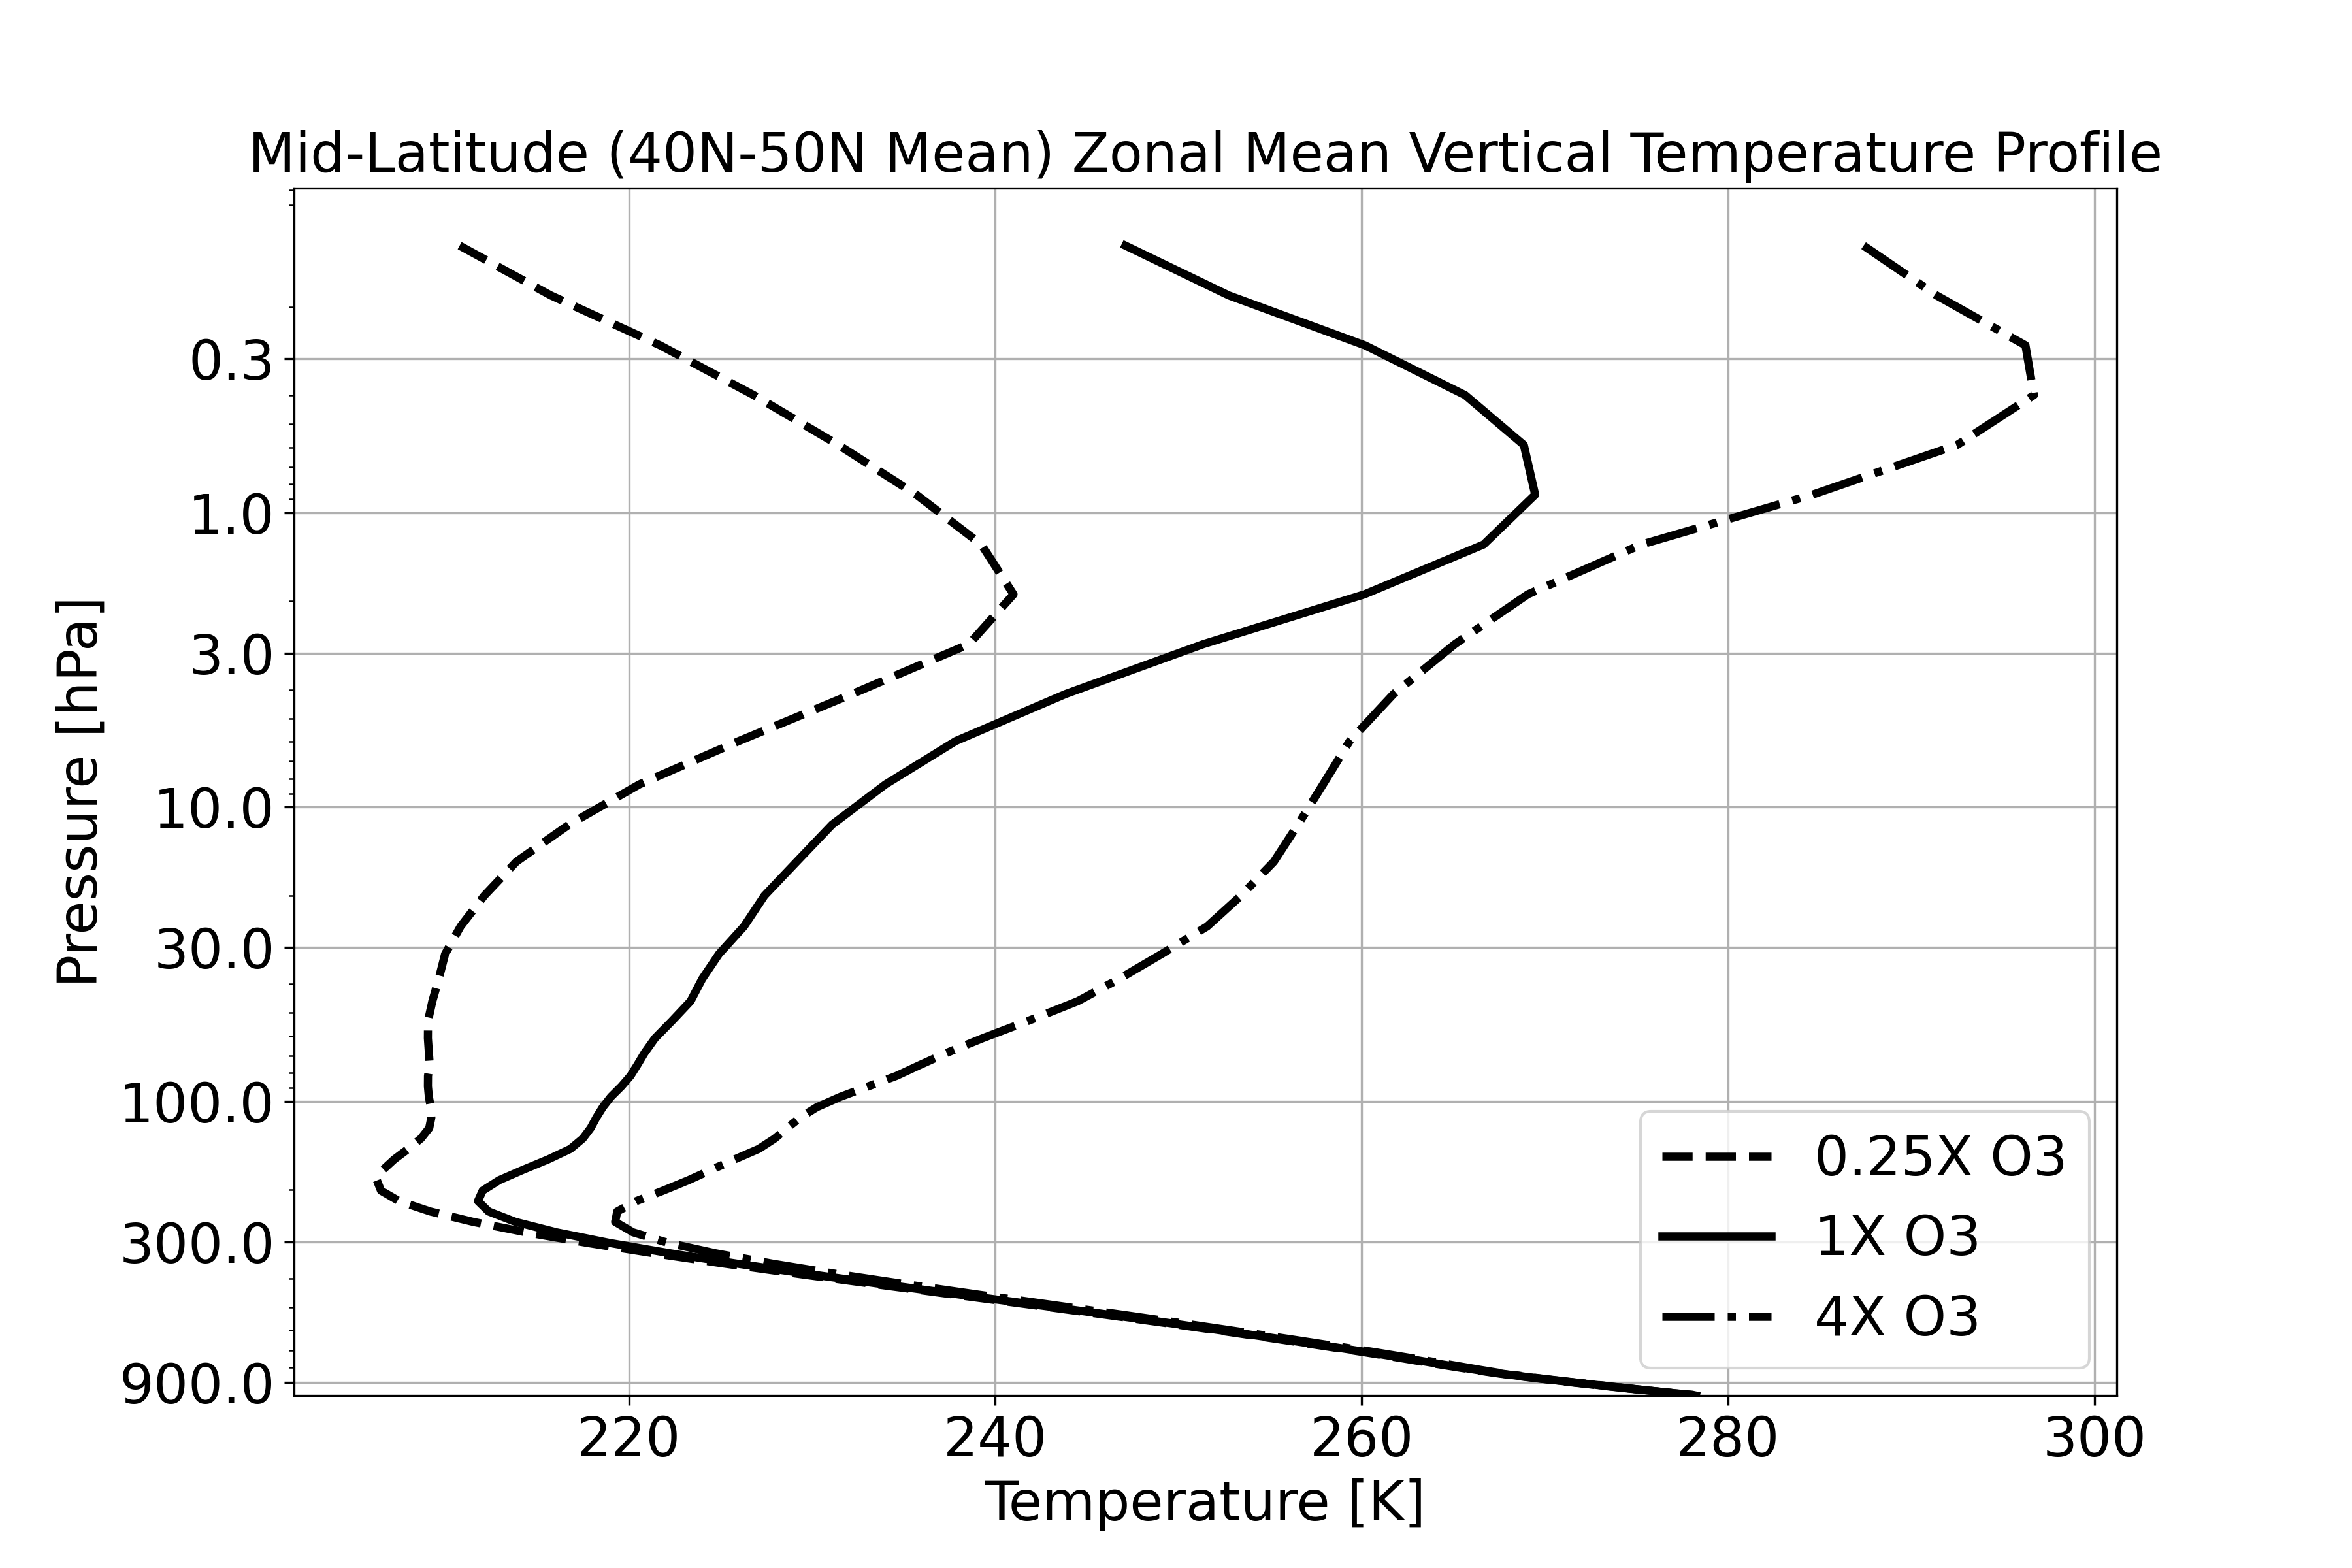
The clearest change that can be observed for the \(4\times\text{O3}\) simulation compared to the control \(1\times\text{O3}\) in Fig. 3 is an increase in stratospheric levels at nearly all levels in addition to a rise in the height of the stratopause and a decrease in the height of the tropopause that create a thicker atmosphere. At larger ozone concentrations, there is more solar absorption in the stratosphere that results in warming, which under a hydrostatically balanced atmosphere creates a thicker geopotential width between the tropoause and stratopause. Moreover, Fig. 3 shows the opposite holds for lower ozone concentrations. In this case, there is less solar absorption in the stratosphere resulting in stratospheric cooling and a thinner stratospheric layer.

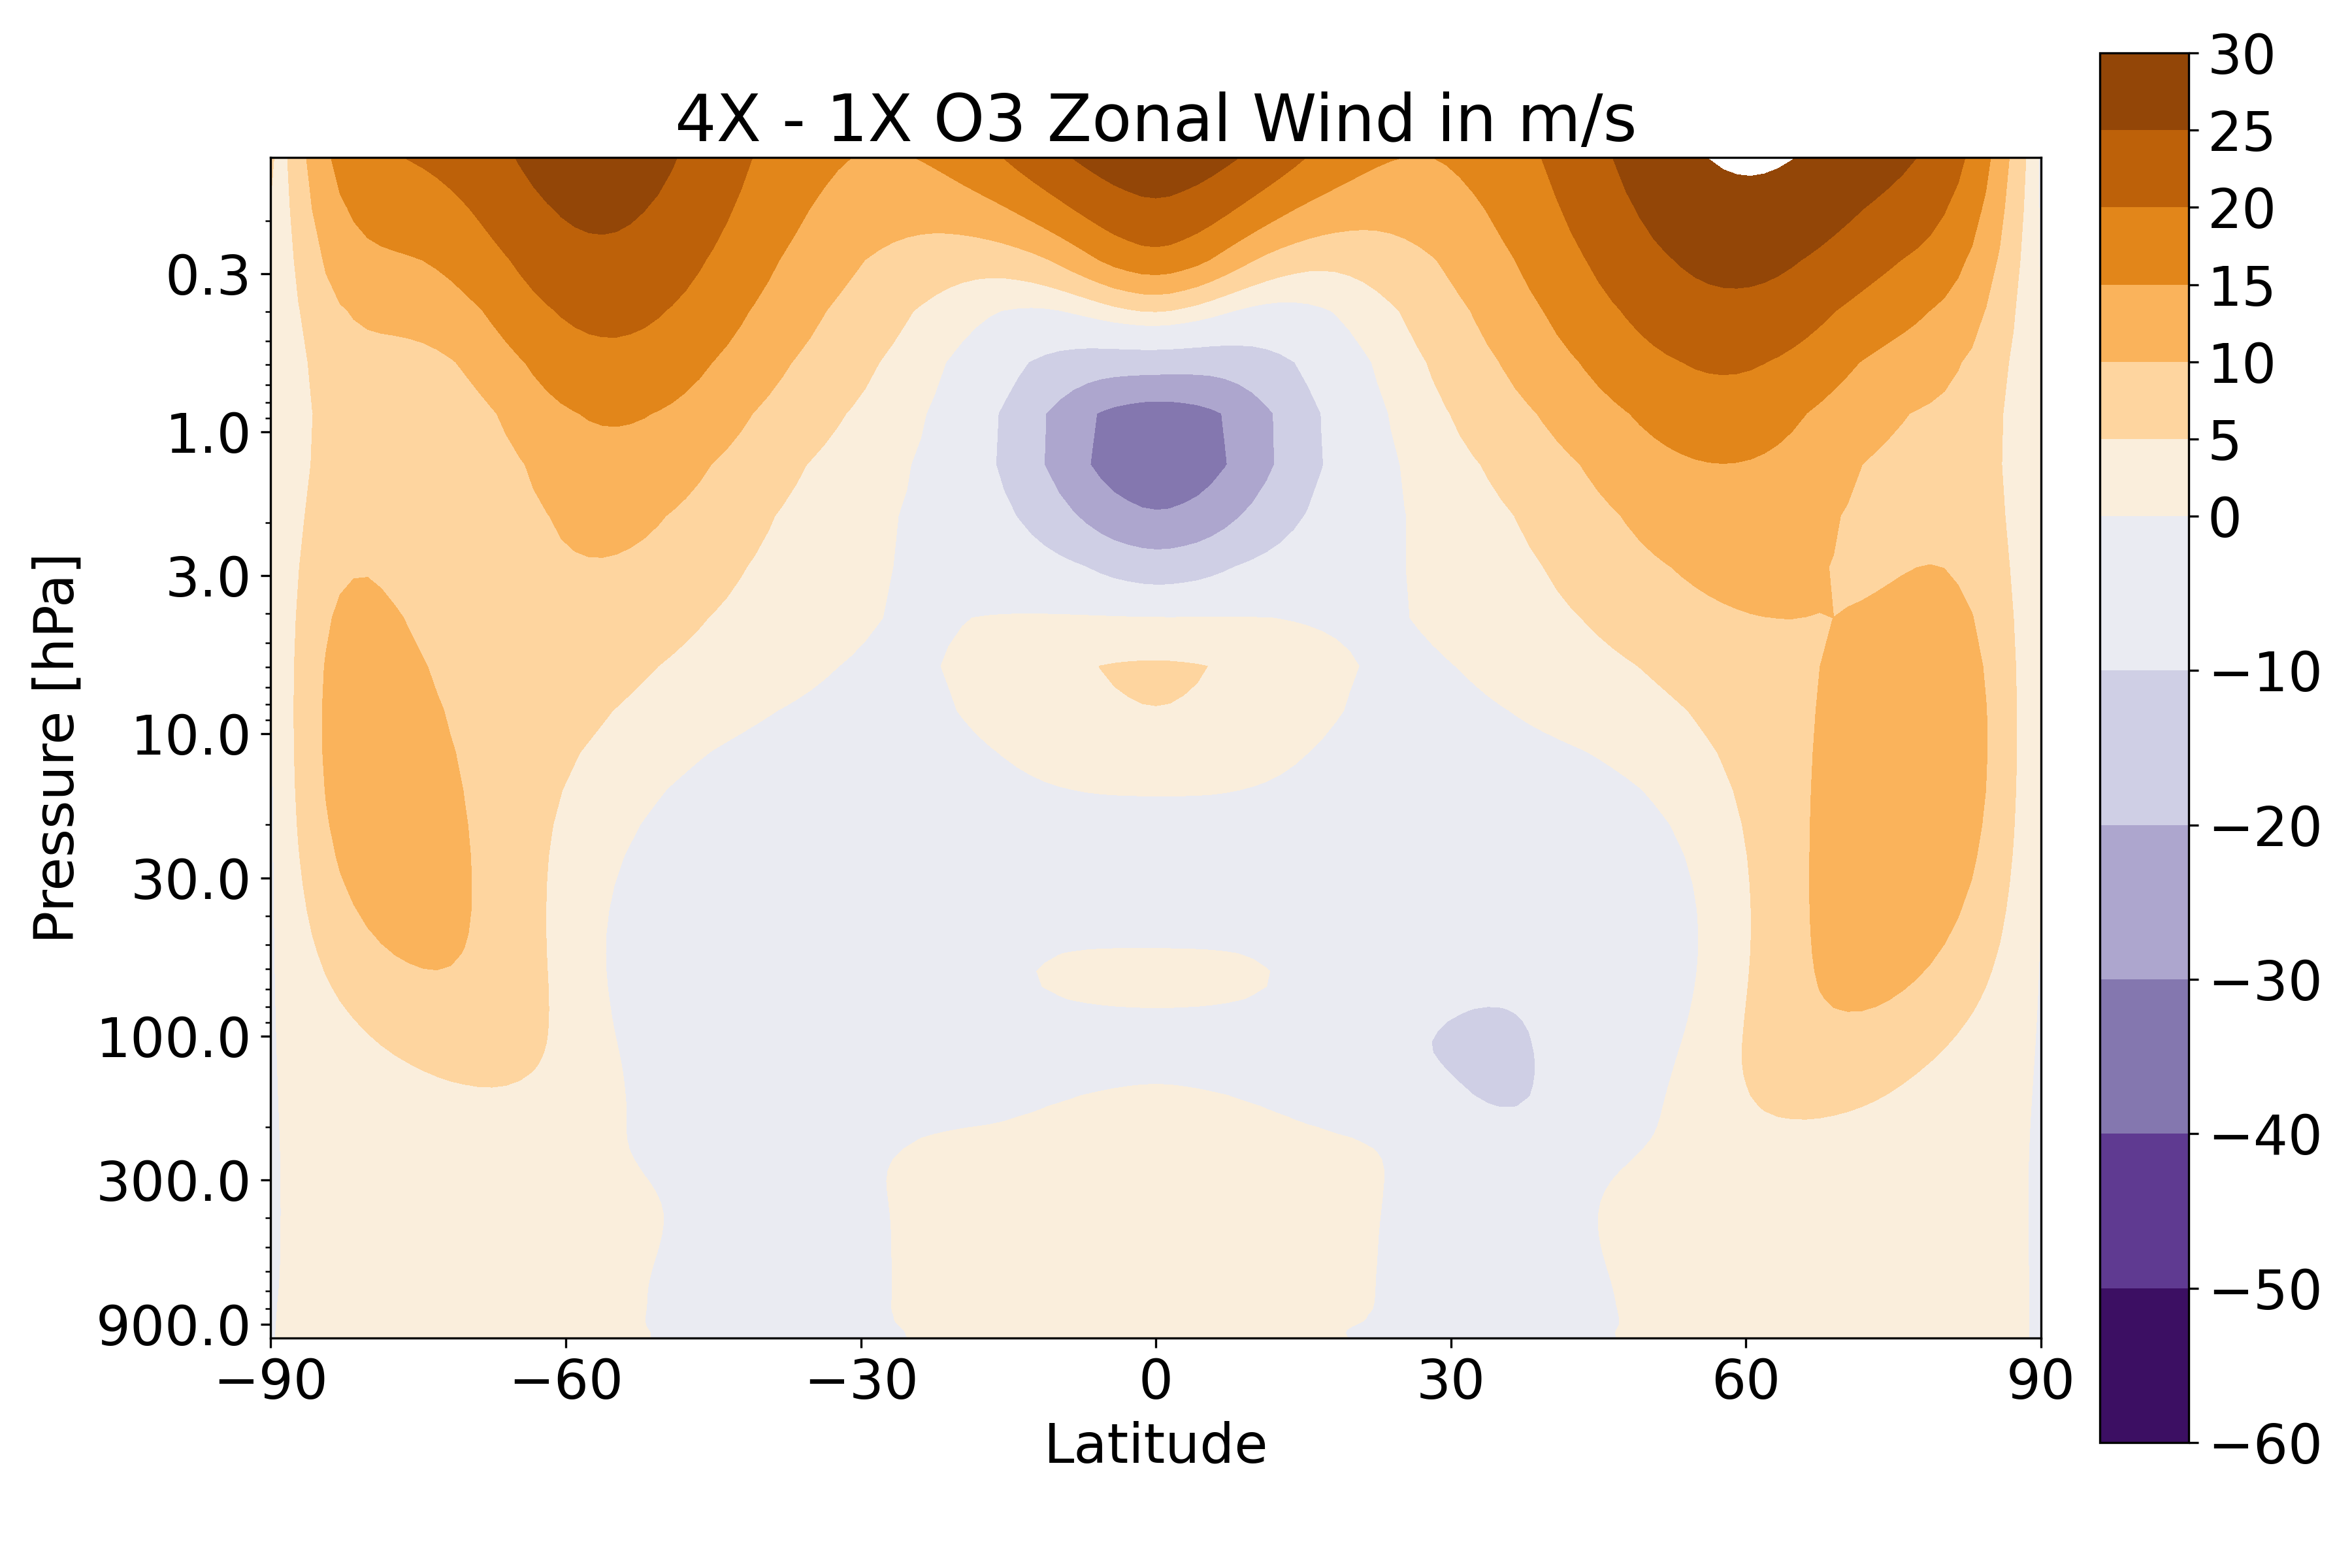
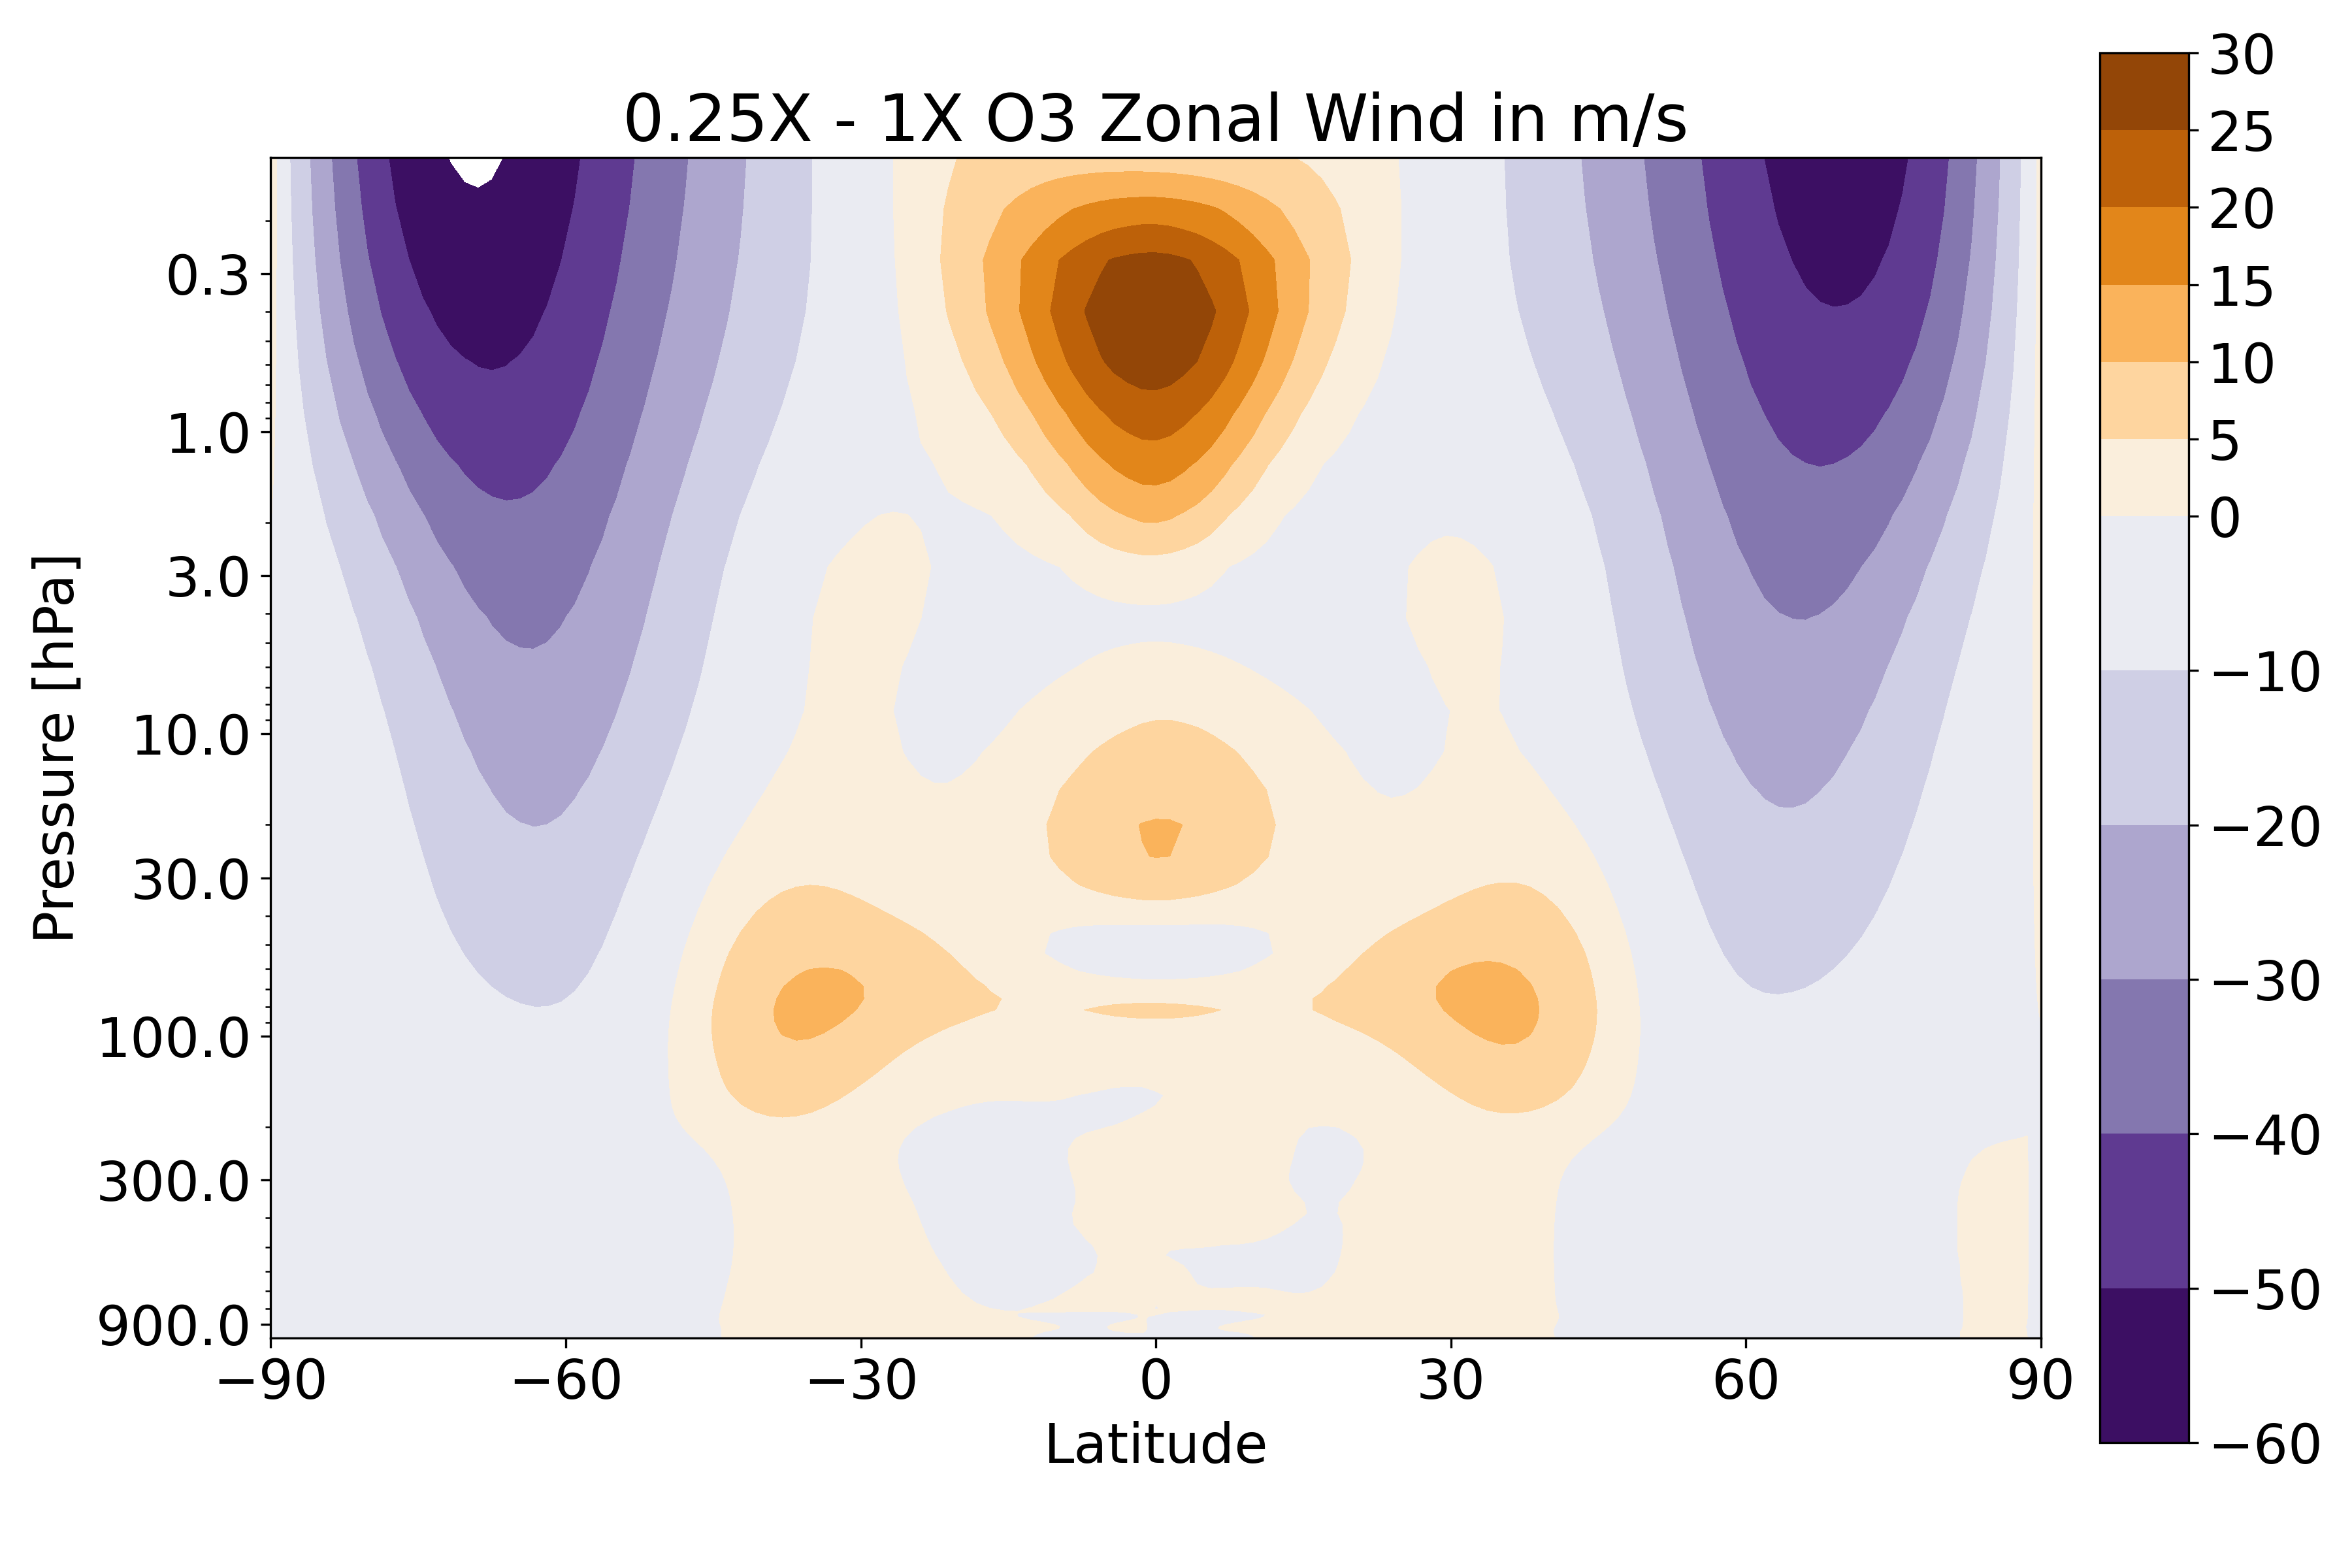
An analysis of the zonally averaged general circulation reveals that ozone concentrations have a strong influence on two circulation patterns: zonal stratospheric jets and the Hadley Circulation at the tropics. The zonal wind in the control simulation and its differences in the \(4\times\) and \(1/4\times\) simulations, shown in Fig. 4, demonstrate that at higher ozone concentrations there are stronger polar stratospheric jets and a weakening in subtropical tropospheric jets of smaller magnitude.
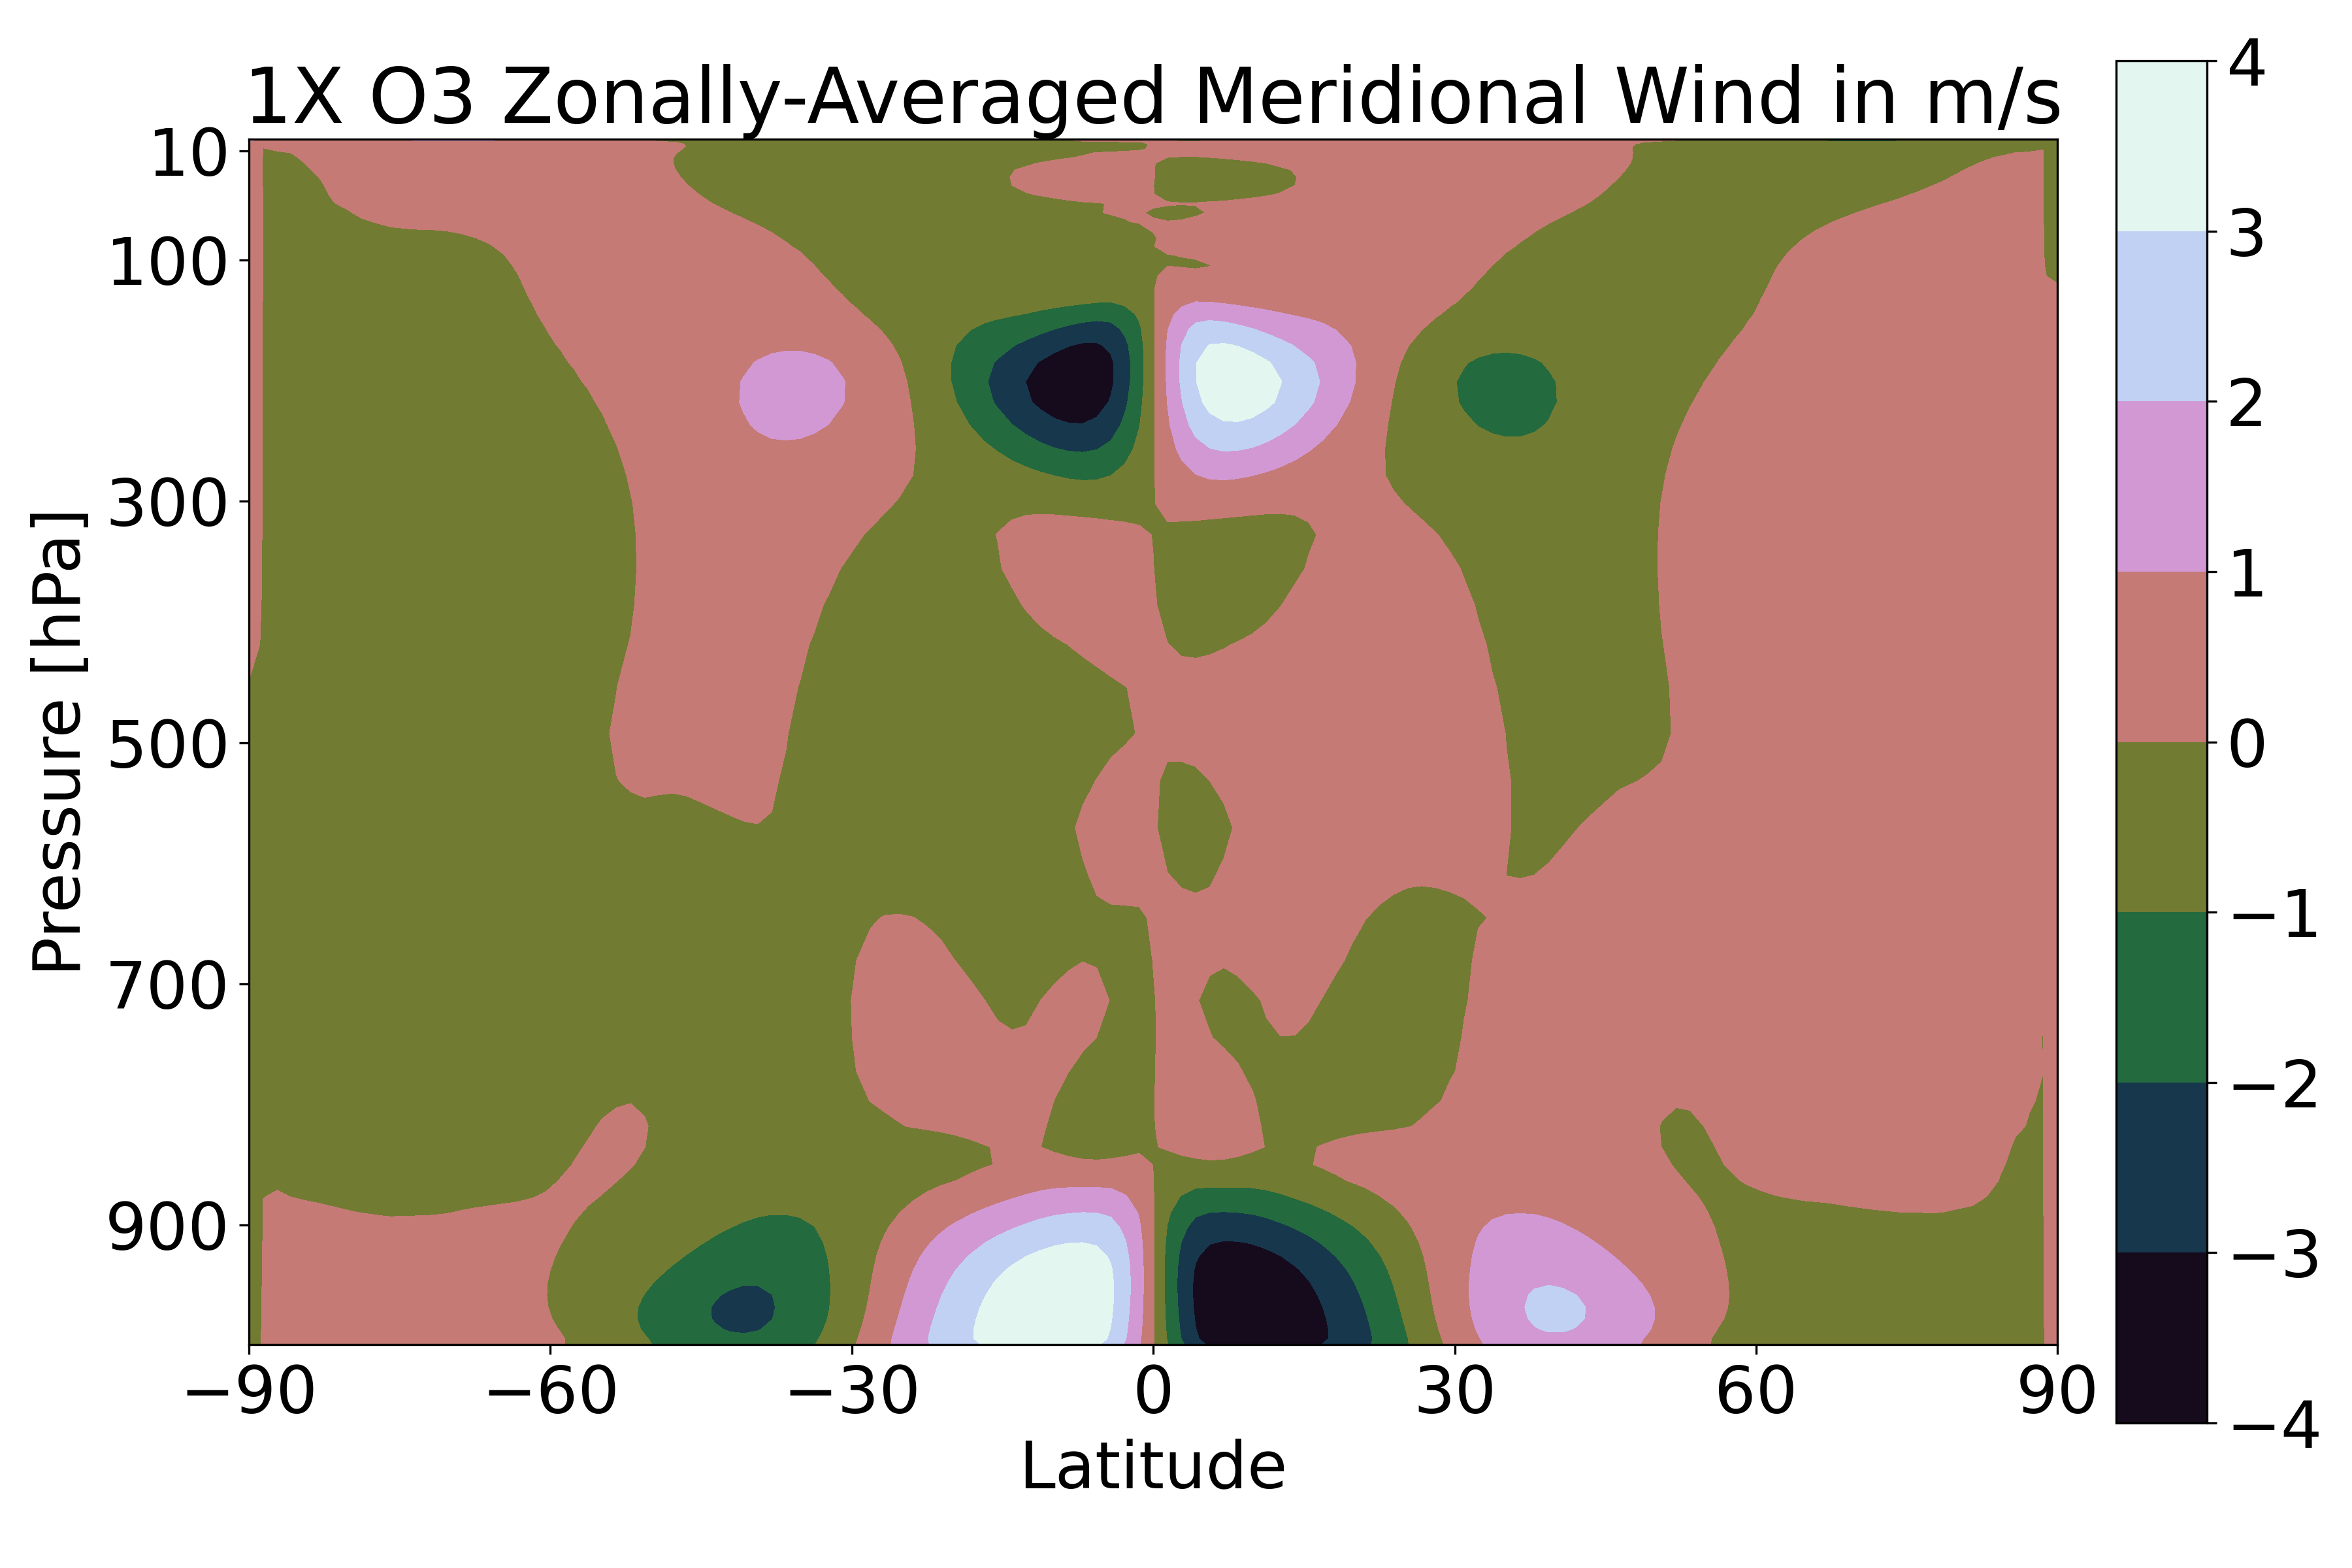
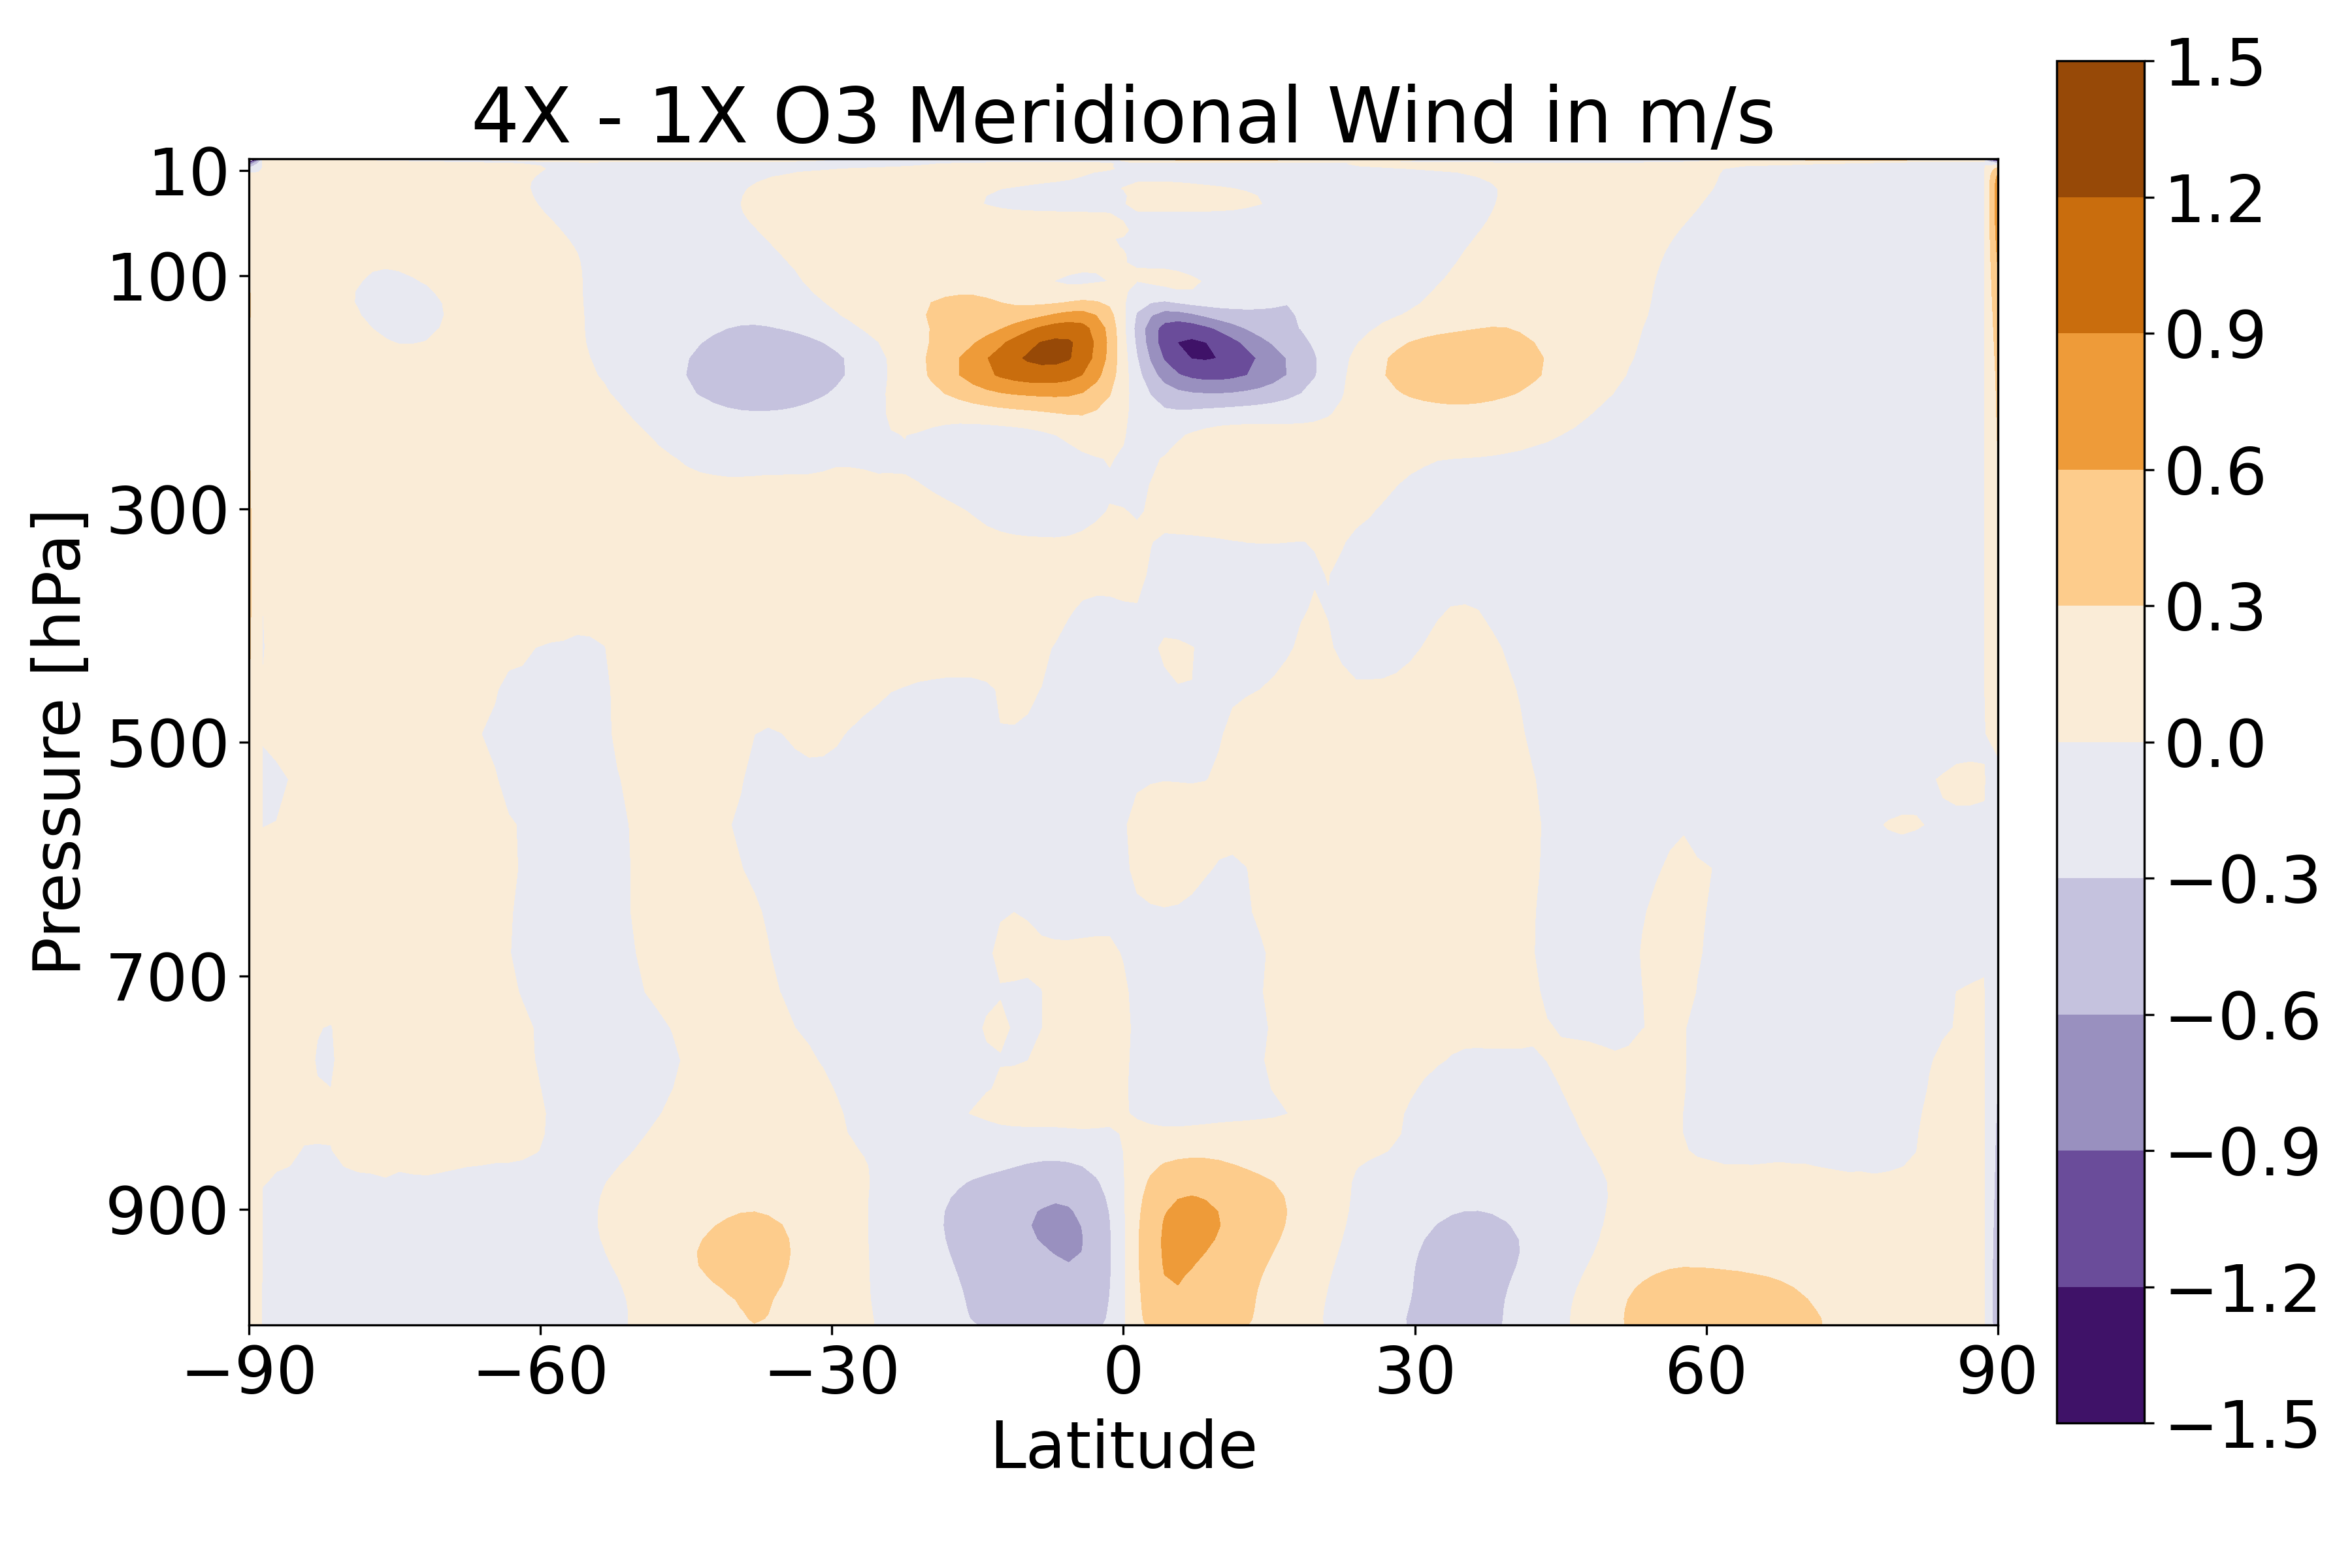
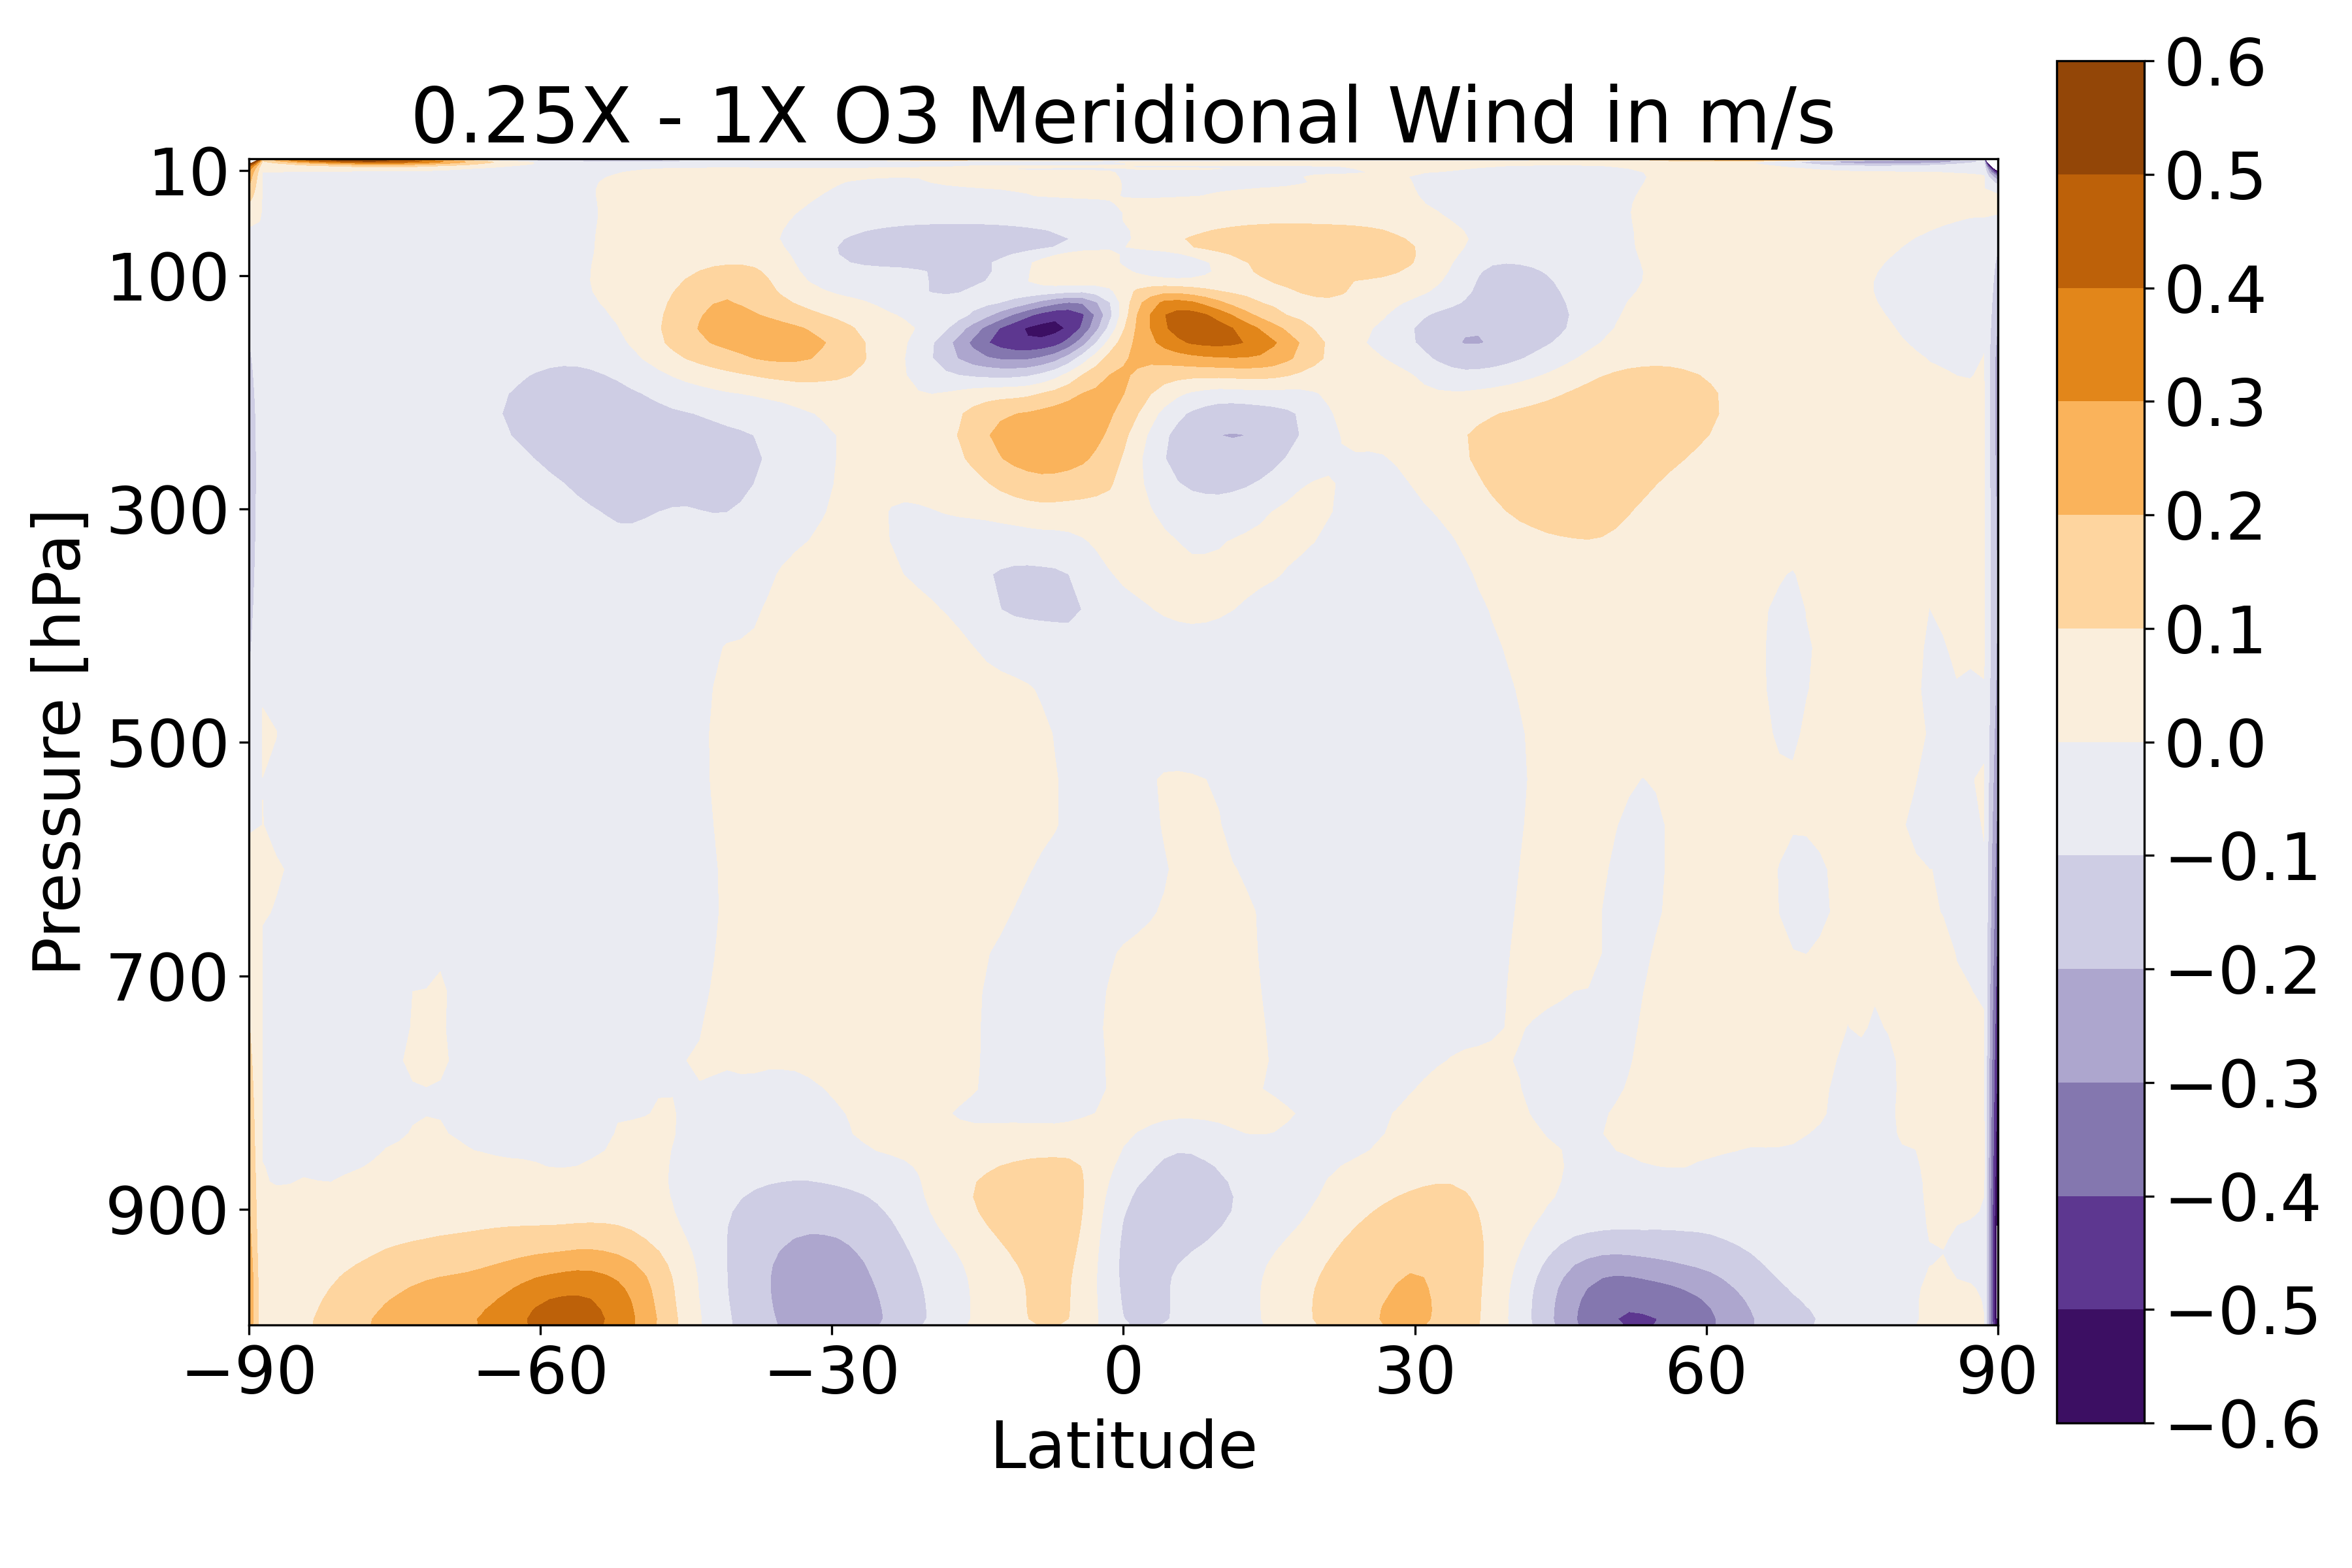
For the zonally averaged meridional wind, Fig. 5, the bottom equatorward meridional flow and top poleward meridional flow at the tropics can be observed. These are the top and bottom branches of the Hadley Circulation, an important atmospheric circulation important in transporting mositure in the troposphere in the tropics and energy poleward. In Fig 5, we can see that larger ozone concentrations correspond to weaker top and bottom meridional flows in the Hadley circulation. An observation of the vertical velocity, shown in the full report at the bottom of the page, shows, at larger ozone concentrations, a decrease in the speed of ascent at the equator and in the speed of descent at 30 degress north and south at the edge of the Hadley cells indicative of a weaker Hadley circulation.
In short, there are five key observations regarding atmospheric circulation for higher ozone concentrations \((4\times\text{O3})\):
- Stratospheric warming
- Thicker stratosphere (higher stratopause and lower tropopause)
- An unchanged lower tropospheric lapse rate
- Strengthened polar stratospheric jets
- Weakened Hadley Circulation
The opposite story is observed at lower ozone concentrations \((1/4\times\text{O3})\):
- Stratospheric cooling
- Thinner stratosphere (lower stratopause and higher tropopause)
- An unchanged lower tropospheric lapse rate
- Weakened polar stratospheric jets
- Strengthened Hadley Circulation
Energy Balance
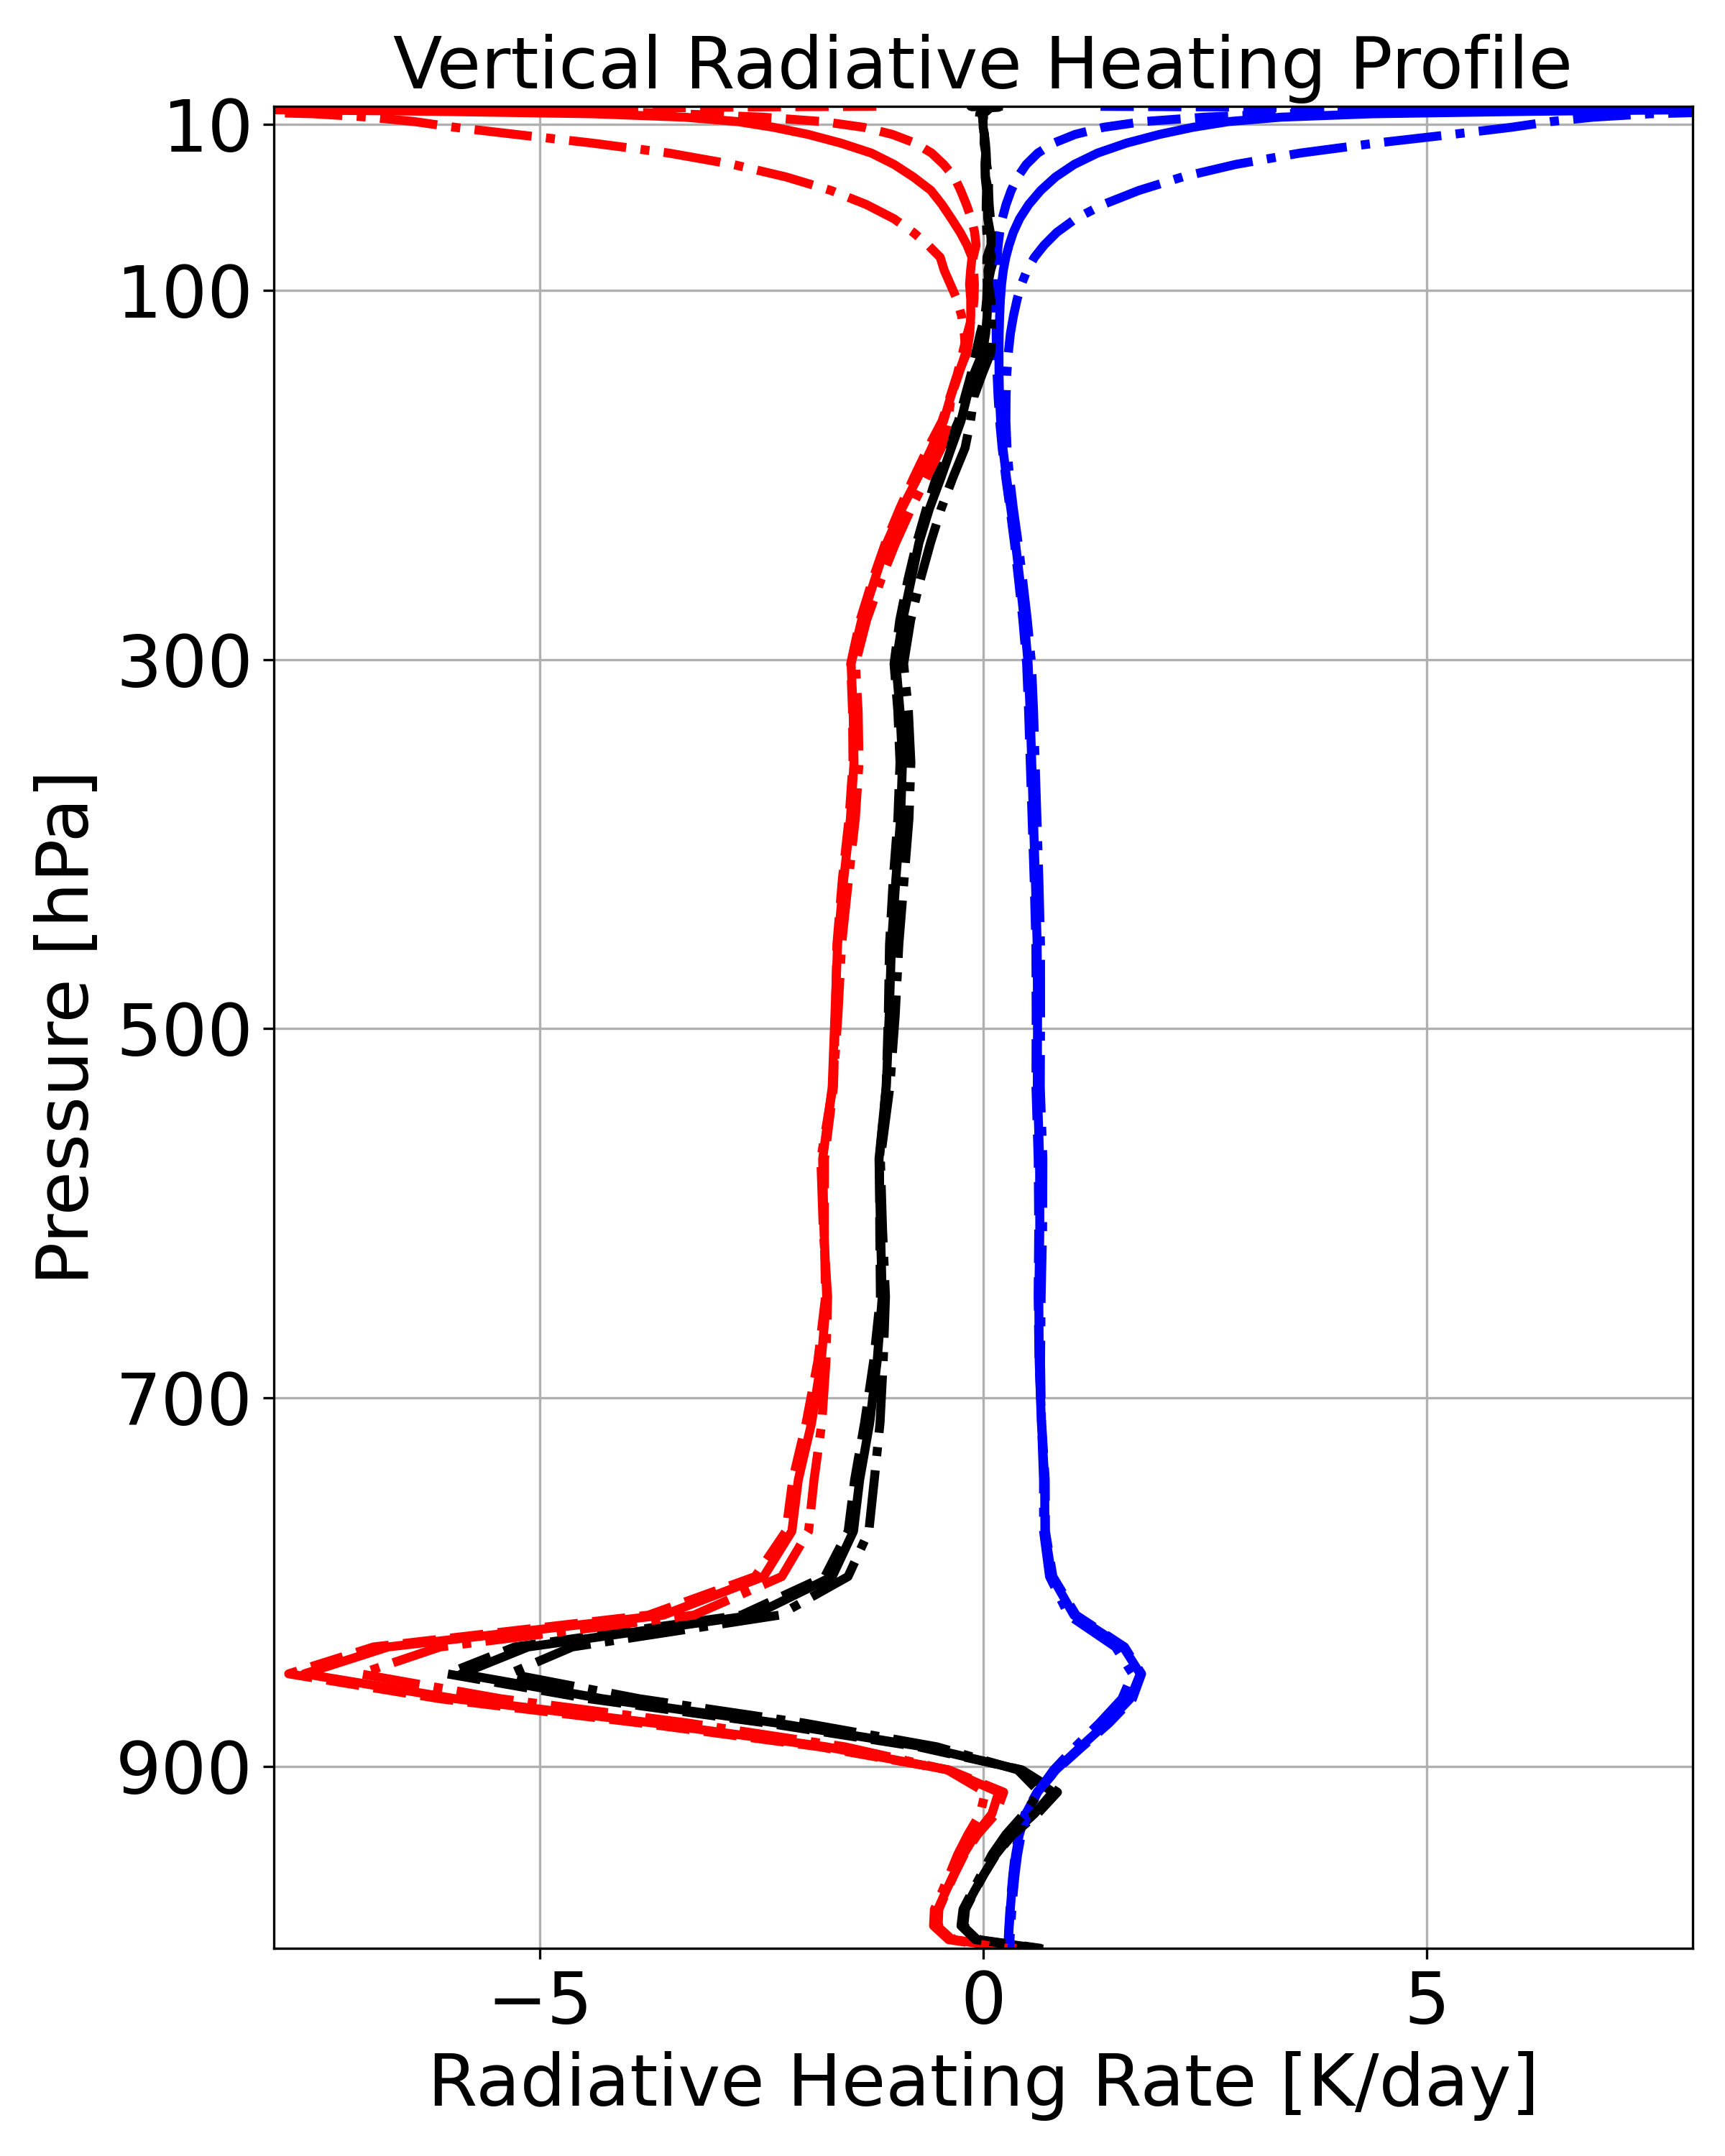
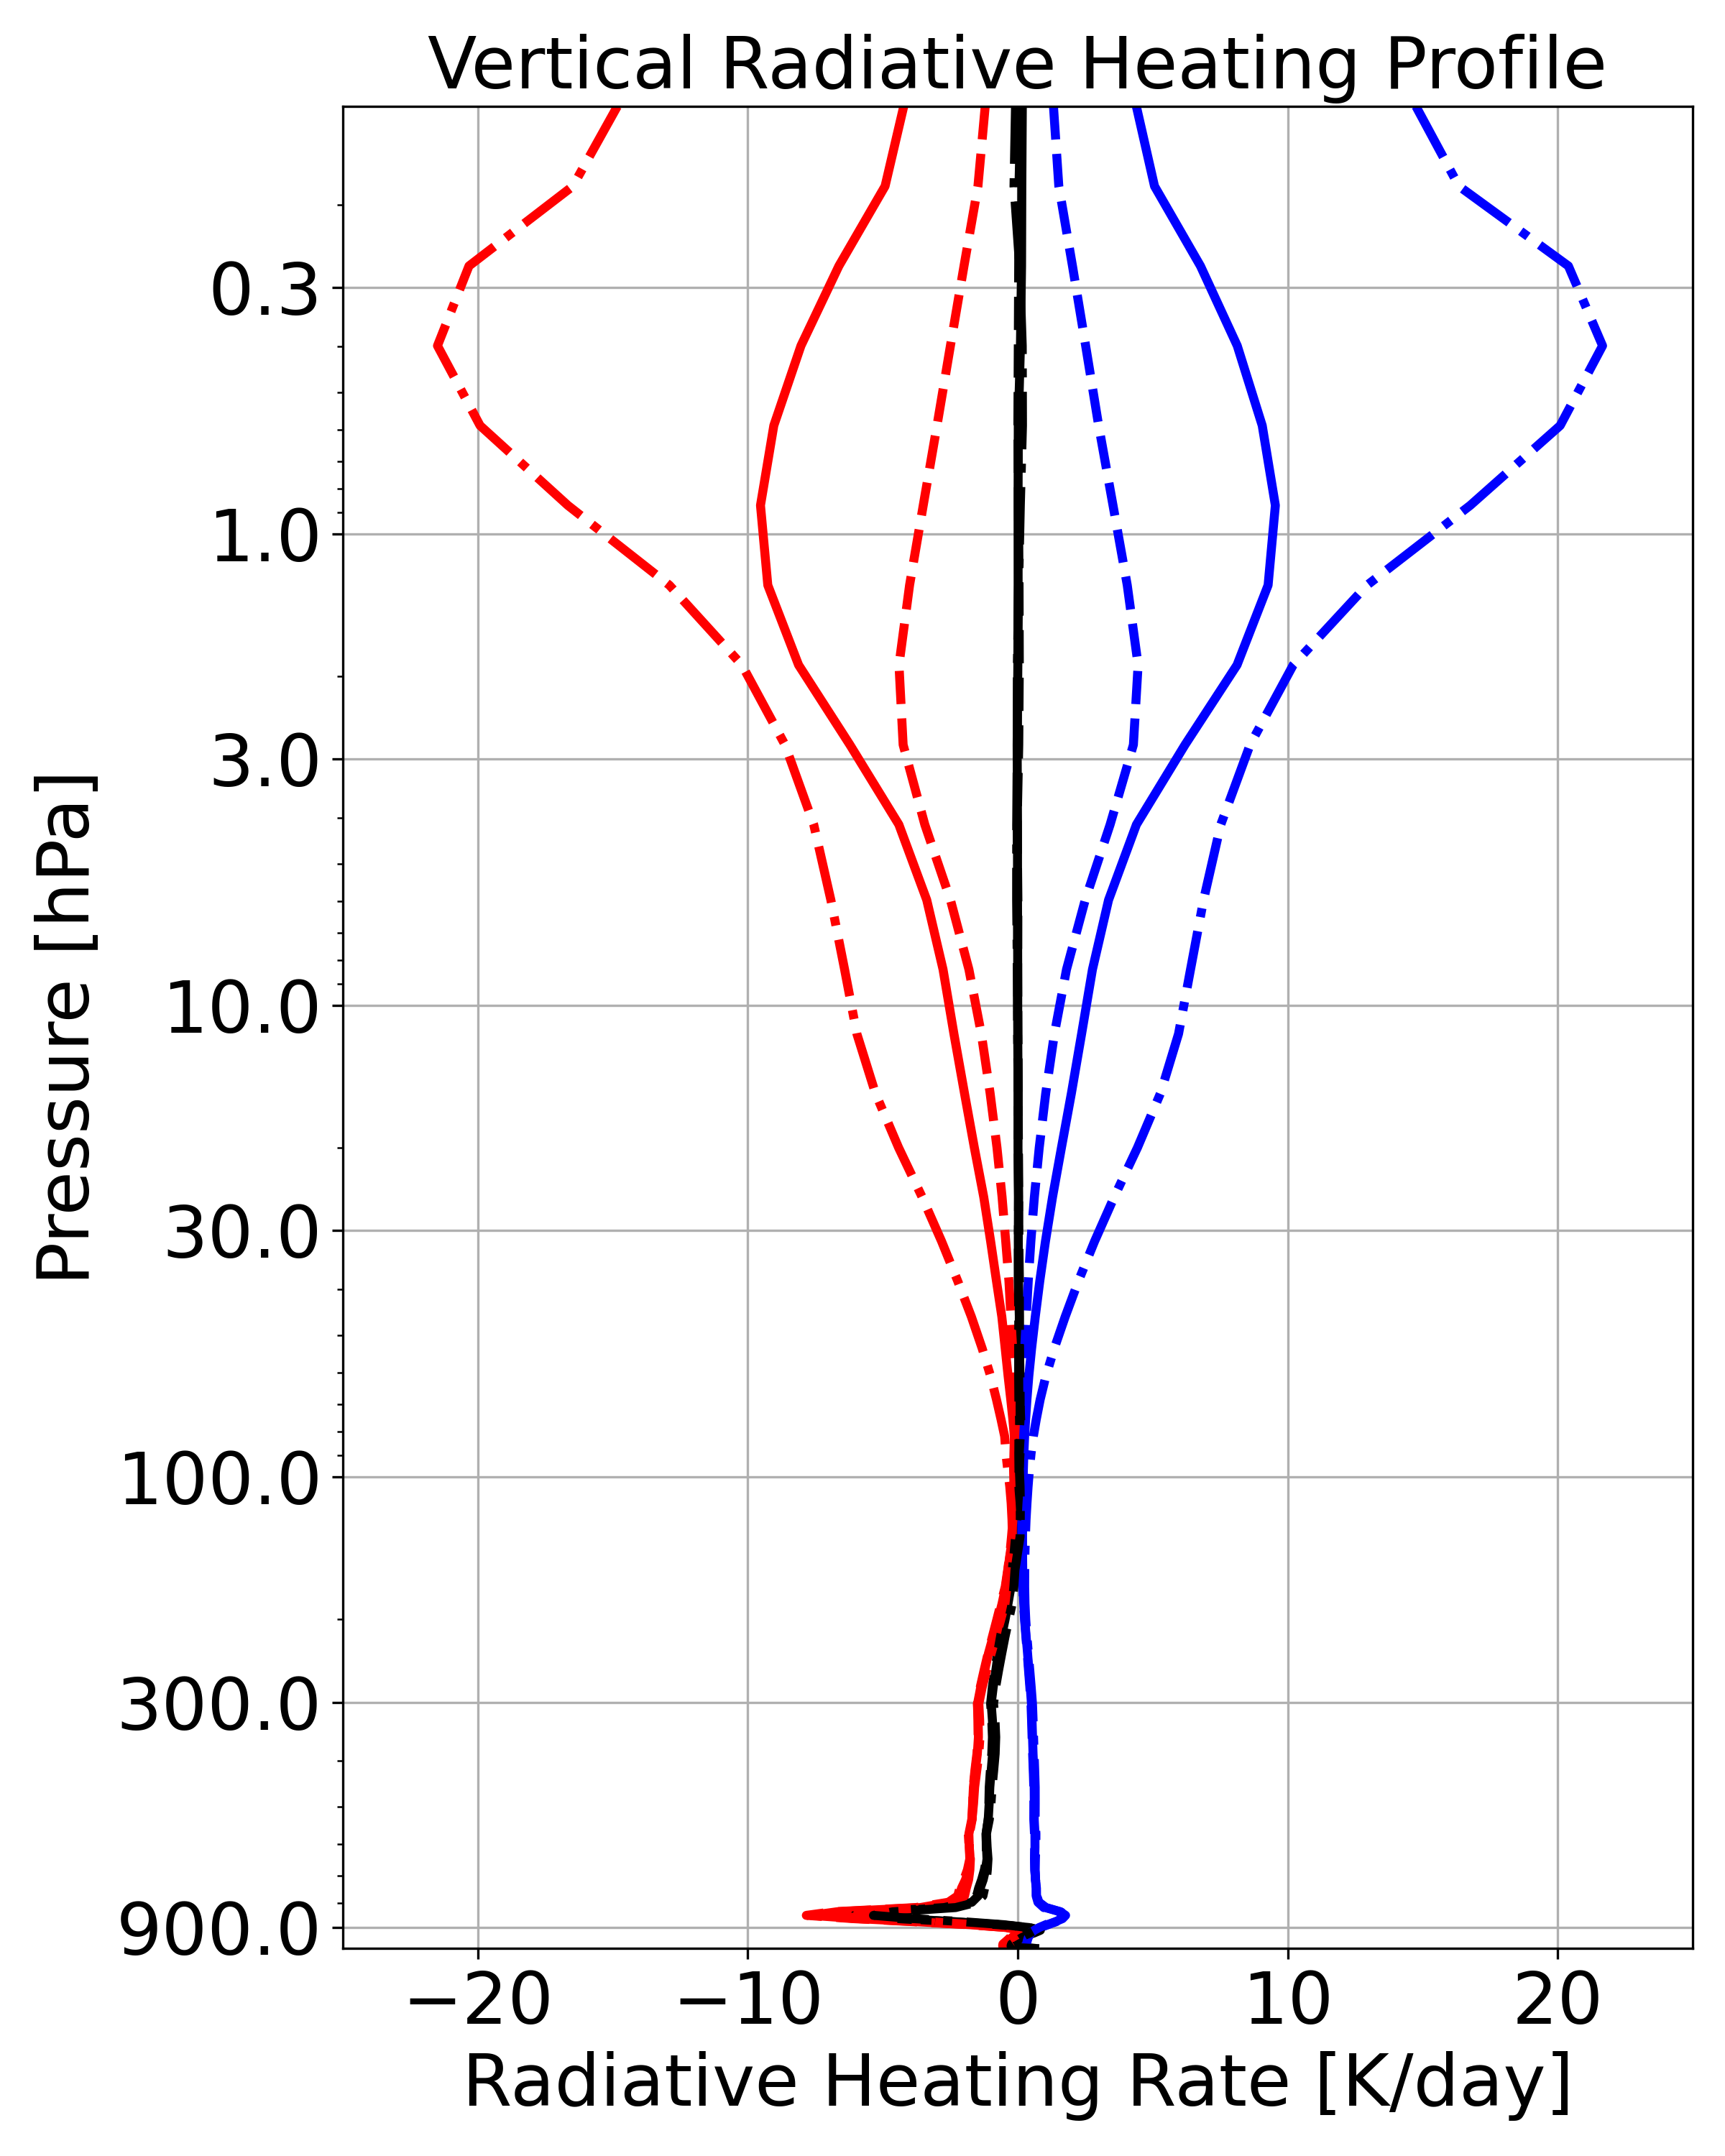
The radiative heating profiles of the 1×O3 aquaplanet in Fig. 6 depict the two key energy balances in the lower atmosphere: a stratosphere in radiative equilibrium and a troposphere in radiative-convective equilibrium. In the stratosphere, the longwave cooling matches the shortwave warming. On the other hand, the troposphere is radiatively cooling which offsets the convective heating from the surface.
For higher ozone concentrations \((4\times\text{O3})\) we see key observations on the radiative heating profiles in Fig. 6:
- The LW and SW heating in the stratosphere increase in magnitude
- The LW and SW budgets in the troposphere are largely unaffected
For lower ozone concentrations \((1/4\times\text{O3})\) we again see the opposite in the stratosphere:
- The LW and SW heating in the stratosphere decrease in magnitude
- The LW and SW budgets in the troposphere are largely unaffected
On the global scale, a stable Earth-atmosphere climate system is in a balance between the incoming solar energy and the outgoing longwave radiation from Earth. Stable is meant in the sense that the climate system is at some equilibrium global average temperature over long time scales. This balance is called the top-of-atmosphere (TOA) balance. It is determined by the amount of solar radiation emitted by the Sun incident on Earth, the planetary albedo, and the outgoing longwave radiation. For our simulations, Earth’s orbital distance and solar luminosity are constants.
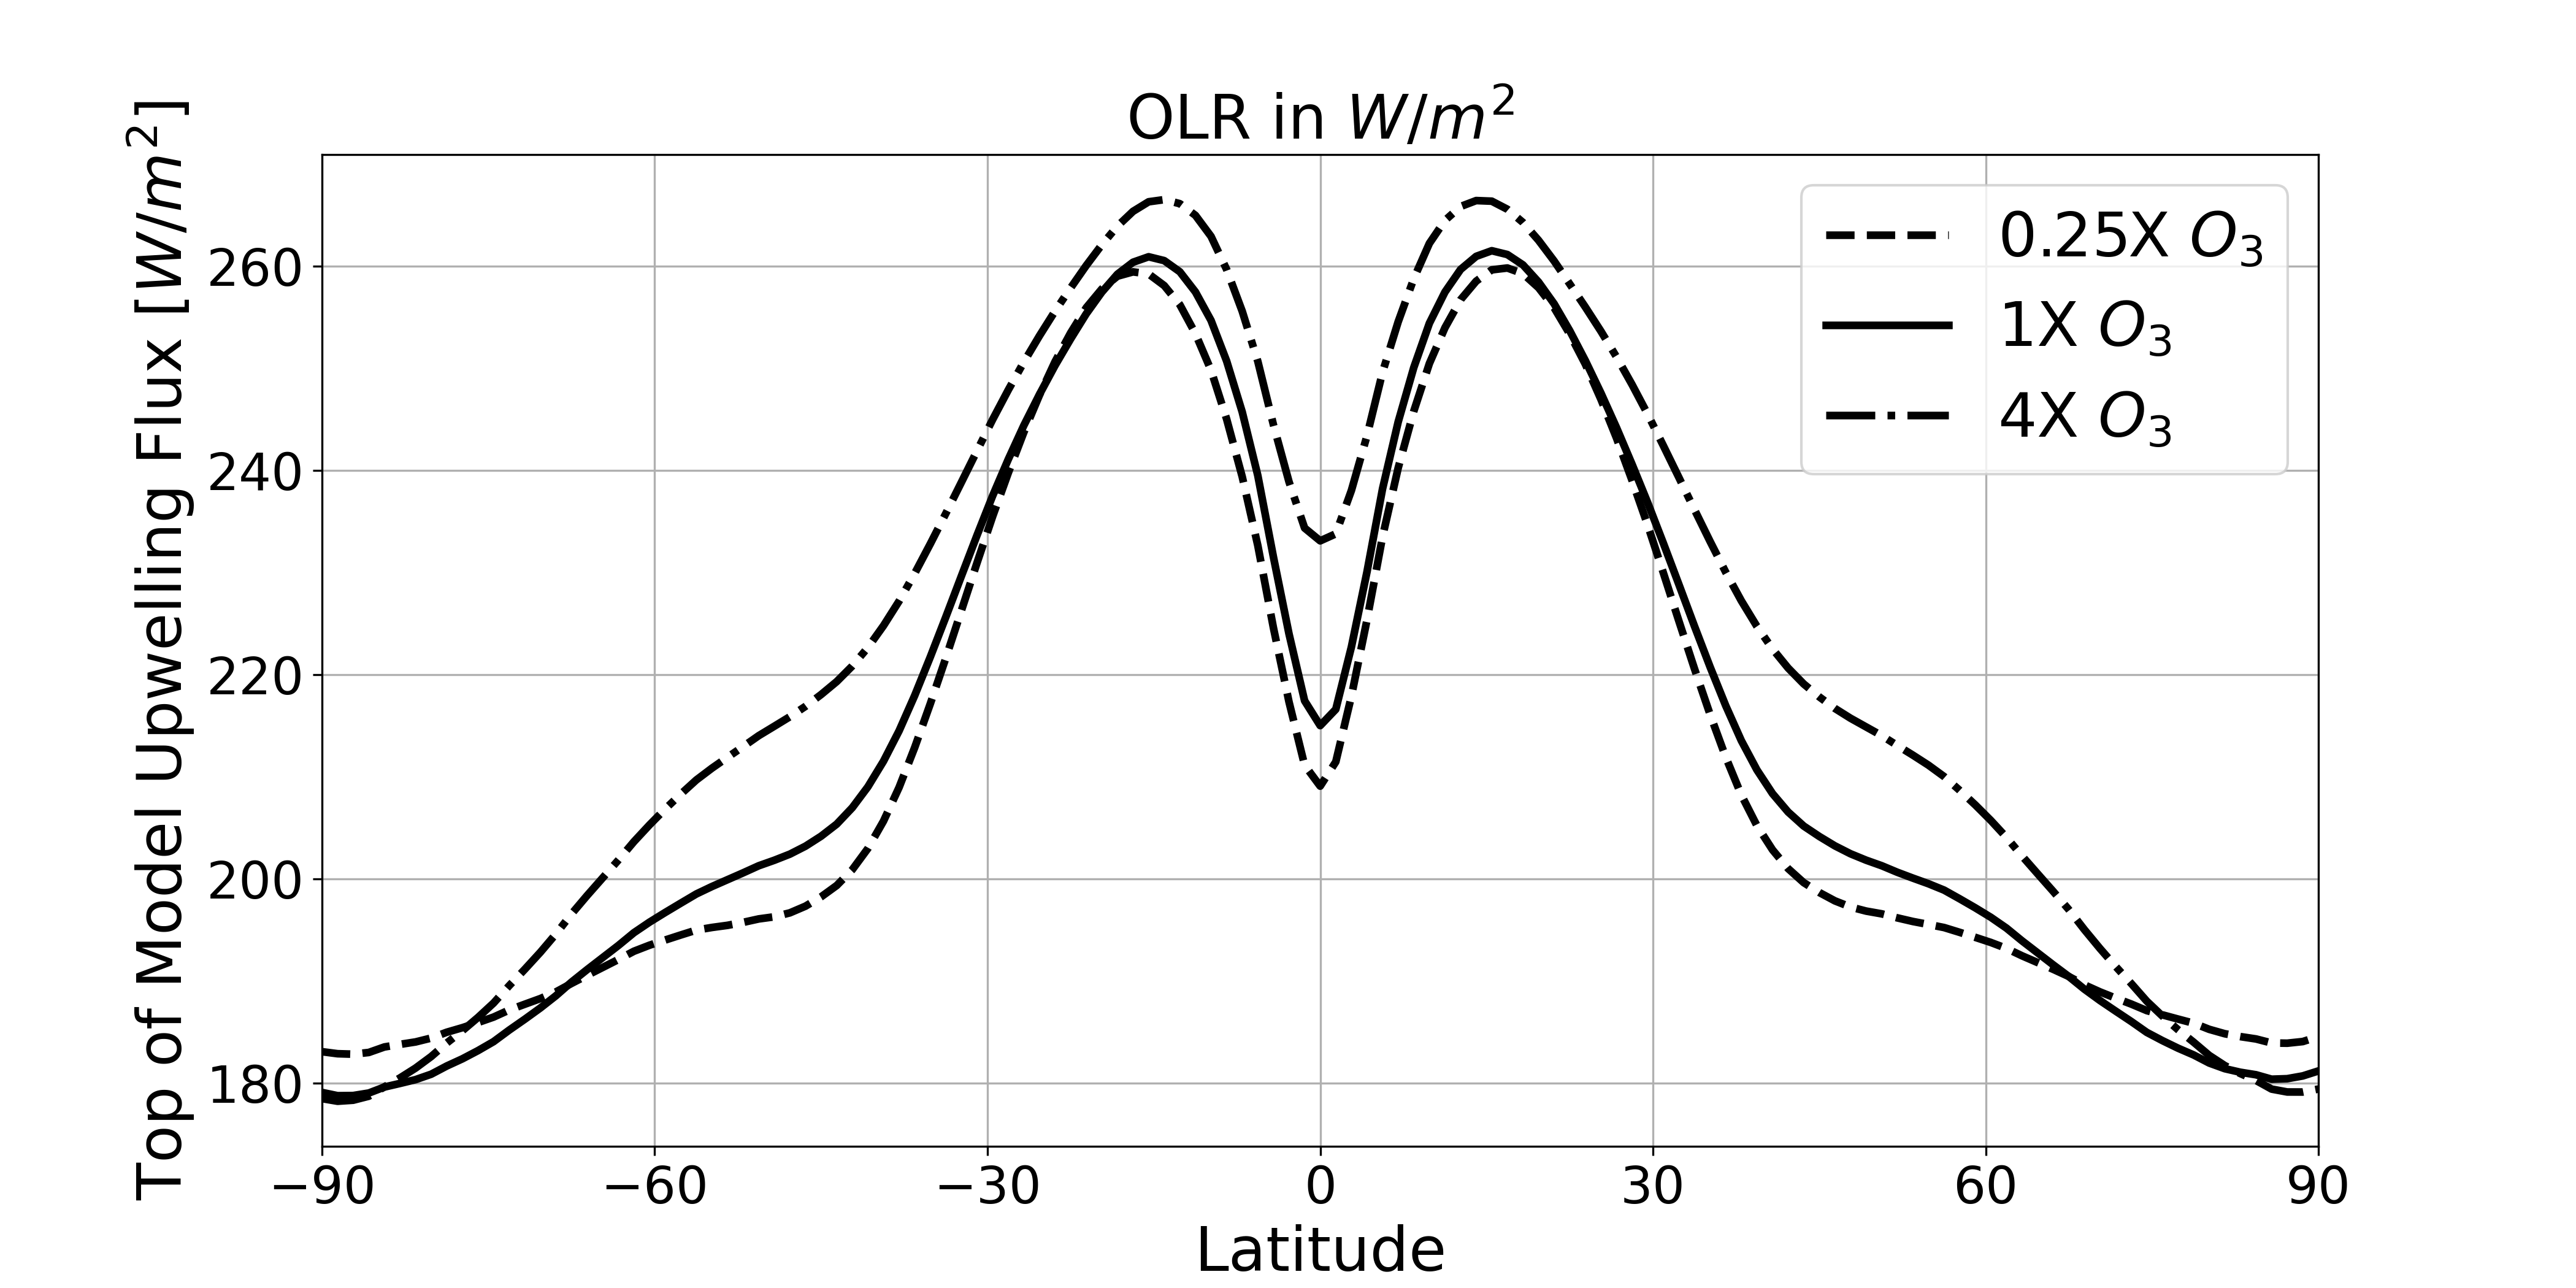
The greater longwave cooling at higher ozone concentrations is a natural consequence of a warmer stratosphere caused by the greater solar absorption from ozone. We might then expect that the greater longwave radiation in the stratosphere would ultimately cause more outgoing longwave radiation at the top of atmosphere. Indeed, as Fig. 7 shows, this is the case and at lower ozone concentrations we analogously see lower OLR on average. To maintain TOA balance, we should expect a decrease in planetary albedo with increasing ozone concentration. The higher prescribed ozone concentrations will naturally contribute to a decrease in albedo due to the greater solar absorption in the stratosphere, but changes in cloud cover can also contribute to changing planetary albedo.
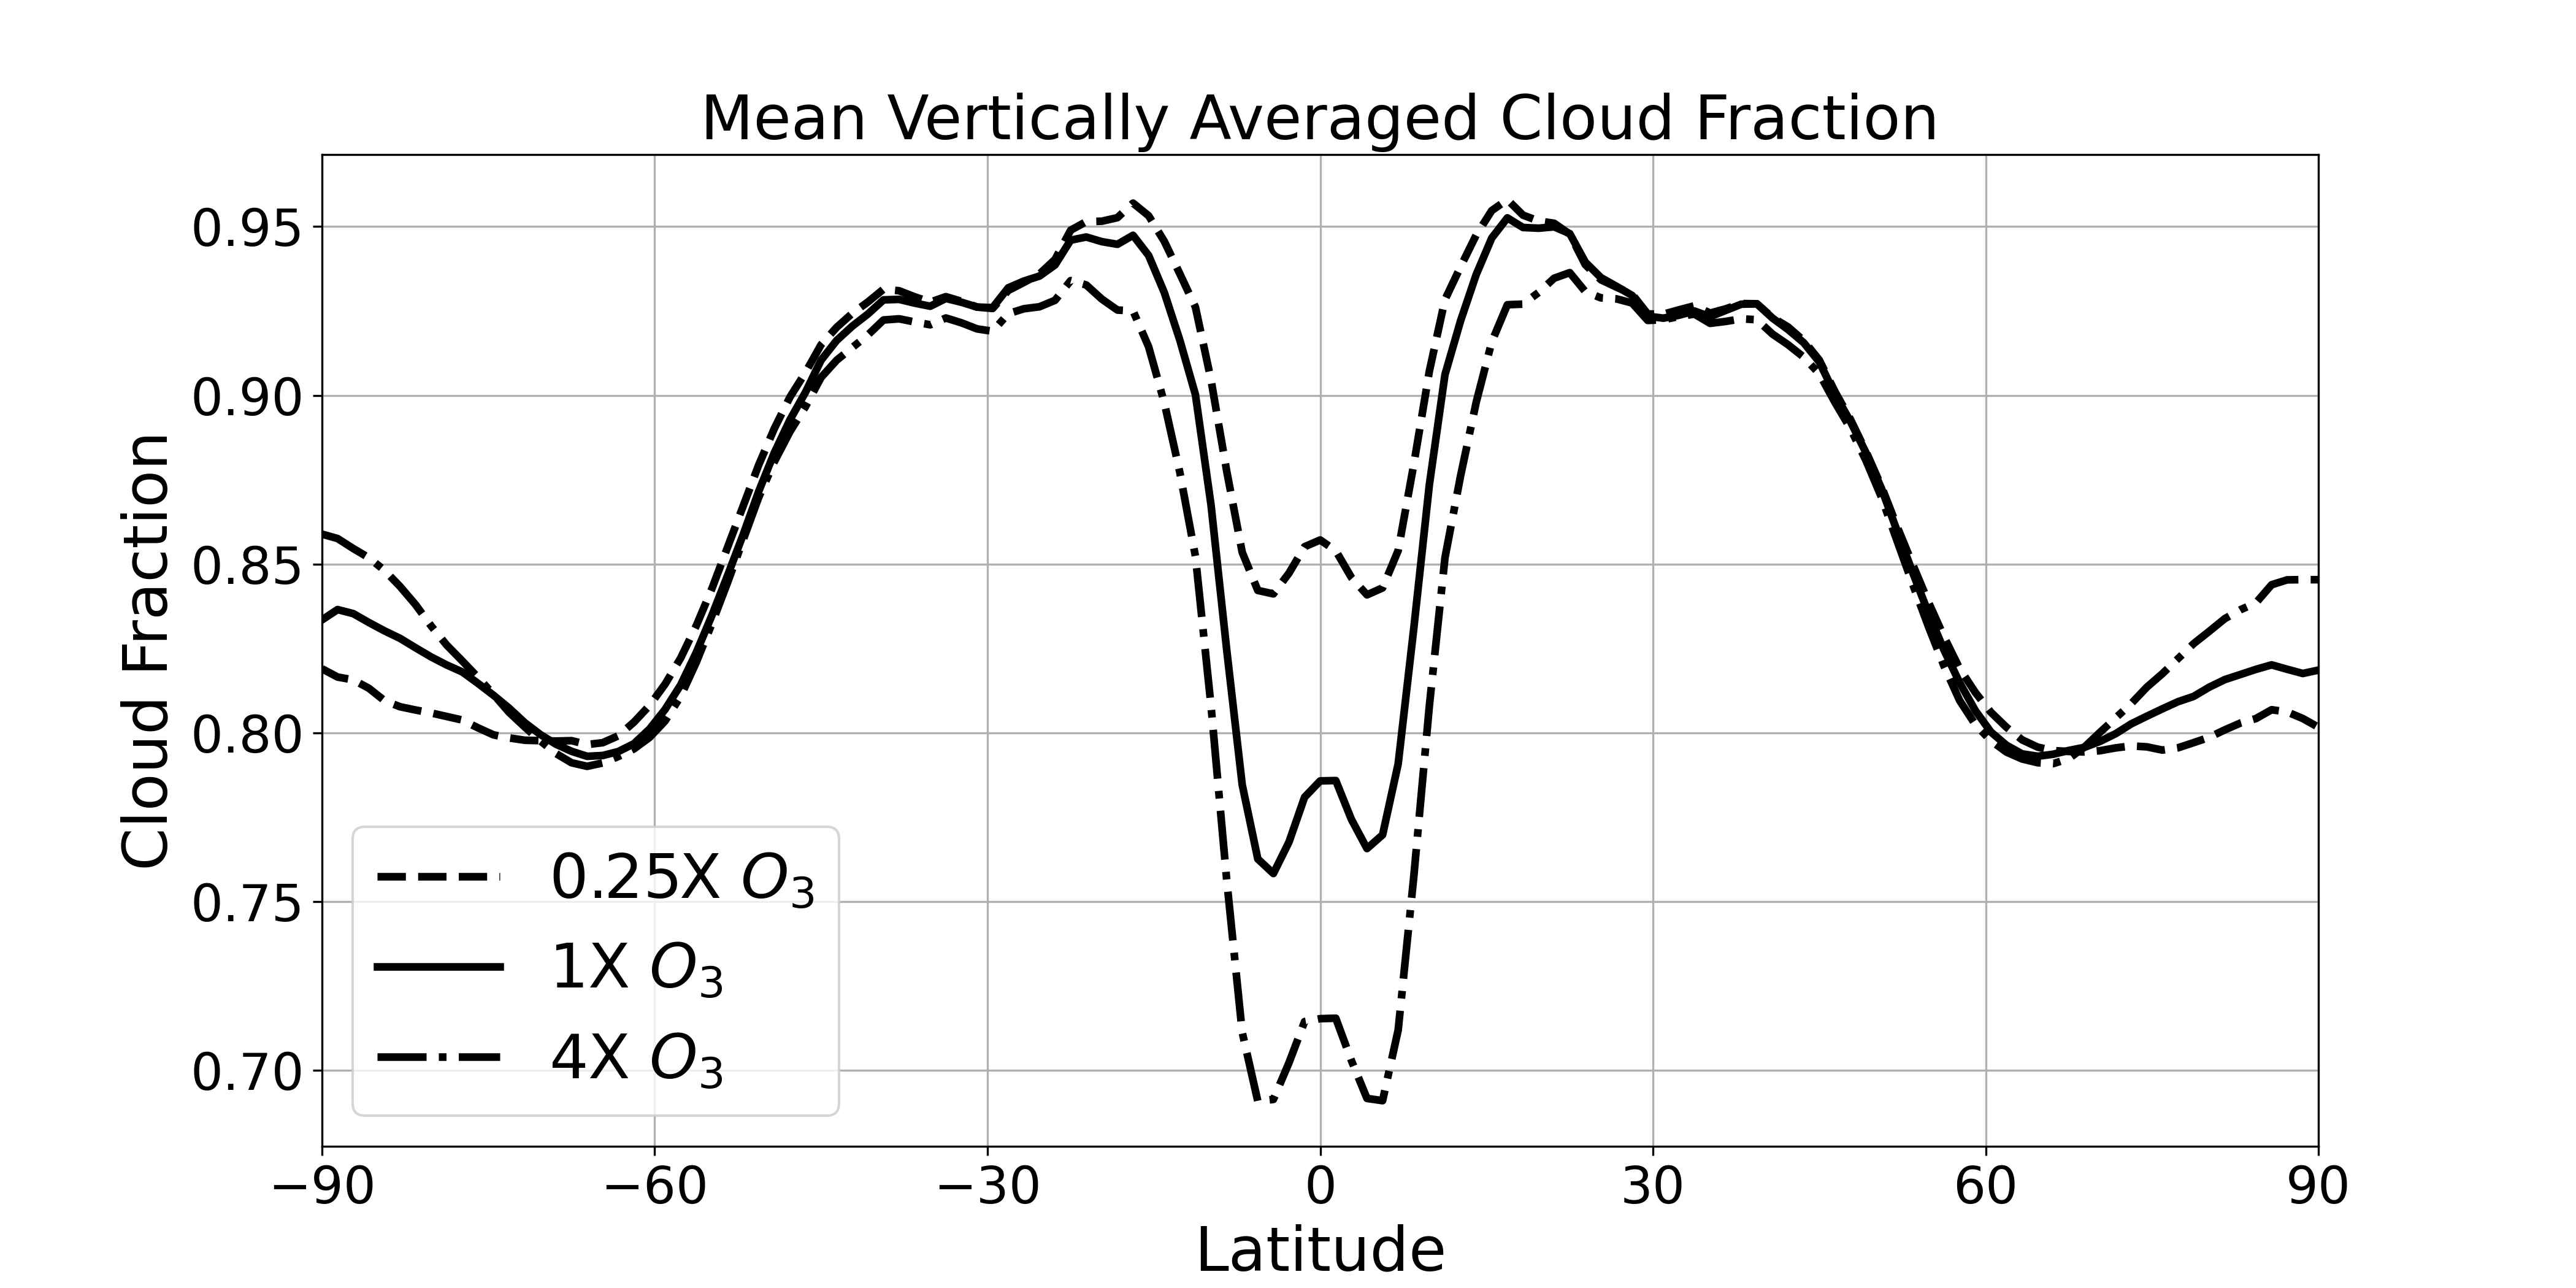
As Fig. 8 demonstrates, the aquaplanet is a largely cloud covered world with vertically averaged cloud fractions between 0.70 and 0.95 across all the simulations. Clouds play an important role in the radiative budget of the atmosphere because of their shortwave albedo effects and their longwave, greenhouse effects. The albedo effects are particularly important for aquaplanets without sea ice because clouds provide one of the only mechanisms that can influence albedo in the troposphere for these aquaplanets. We see in Fig. 8 an inverse relationship between global average cloud cover and ozone concentration that contributes to the decrease in planetary albedo expected for higher ozone concentrations. In the \(4\times\text{O3}\) run, we see that a decrease in global cloud cover causes a decrease in planetary albedo (greater solar absorption) that offsets that greater OLR to maintain the TOA radiative balance.
In short, Fig 7. and Fig. 8 display the TOA balance. At higher ozone concentrations:
- Globally averaged OLR increases
- Globally averaged cloud cover decreases (solar absorption increases)
At lower ozone concentrations:
- Globally averaged OLR decreases
- Globally averaged cloud cover increases (solar absorption decreases)
Quasi-Biennial Oscillation
While the focus of this project has primarily been on how climatological, zonally averaged quantities have changed in response to ozone, ozone concentration can also influence oscillations in the general atmospheric circulation. One such oscillation, is the quasi-biennial oscillation (QBO) in the stratosphere. The QBO is an oscillation in the prevailing tropical stratospheric zonal winds. The QBO has an easterly and a westerly phase. The phases are asymmetric in the sense that the easterly phase is larger in amplitude (wind speed). Each QBO phase begins at the top of the stratosphere, with the new prevailing wind spreading downwards until it hits the tropopause. To obtain the QBO in the aquaplanet simulations, we adjusted the CAM4 configuration to enable gravity wave production by frontogenesis and deep convection, which are necessary in driving the QBO. The QBO for the control aquaplanet can be seen in Fig. 9, which is similar in structure to the QBO observed on Earth.


Fig. 9 shows the QBO calculated for the \(4\times\text{O3}\) and \(1/4\times\text{O3}\) simulations. At lower ozone concentrations, the QBO period becomes shorter and the increase in tropopause height can be observed by the rise in the band of westerly winds around \(100\text{ hPa}\). At higher ozone concentrations, the QBO period is extended and more asymmetric with longer easterly phases compared to shorter and weaker westerly phases.
Future Work and Questions
Due to the short time frame for the project, the scope of this analysis is limited. There are several interesting questions that these results bring up. It is particularly intriguing how insensitive the tropospheric lapse rate and energy balance is at different ozone concentrations. In a realistic atmosphere, where surface temperatures are allowed to change, an increased greenhouse effect (such as by increasing ozone) would increase surface temperatures and also have an influence on the lapse rate through changes on the atmospheric moisture content. Is the forcing of SSTs that prevents changes in surface temperature also inhibiting changes in the lower tropospheric lapse rate? Another area of further study is in the exploration of what other variables influence the tropopause height besides ozone.
Interestingly, while the results presented here hold well for the tropics and subtropics, there are significant differences in the radiative balance trends in the polar regions. An interesting question lies in the asymmetry observed between the polar response and the subtropical/tropical response to changing ozone concentrations. Is the polar asymmetry a necessary result to ensure poleward transport of energy with latitudinally-varying ozone and SST distributions that peak in the tropics?
Finally, the analysis of cloud properties in this paper only scratched the surface. On an aquaplanet, it is clear that clouds are important in controlling the planetary albedo and influencing the LW radiative balance. Conducting a more thorough analysis on the complex properties of clouds on the aquaplanet system could reveal interesting feedbacks between the stratospheric radiative balance and tropospheric clouds, particularly those near the tropopause.
The Full Report
If you’re interested in learning more about this project, I wrote a full report for my course project that includes more figures and details. You can access the report below:
If the PDF does not render, you can access the report at the following link: Stratospheric_Ozone__CLIMATE_473_Project_Report.pdf